The Daily Summary Dashboard is designed to provide a quick and easy overview of your hotel’s daily performance. The dashboard provides a holistic view of the current month by combining consumed stay dates with current on-the-books data, pickup activity, forecasts, and budgets into a single centralized view looking out into the next 3 months.
What You Can Expect from This Dashboard
The Daily Summary Dashboard helps users:
- Monitor hotel performance daily
- Track rooms revenue and ADR trends
- Review pickup activity
- Compare results against budget and forecast
- Compare performance against last year
- Quickly drill across to more detailed dashboards
Dashboard Tabs
This Month
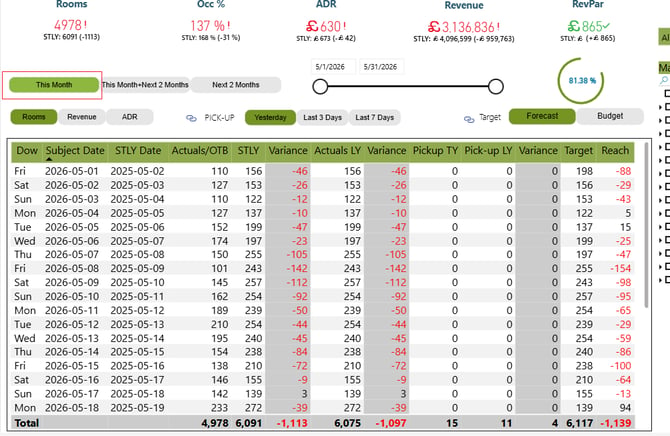
This tab displays:
- Actualized (consumed) performance for the current month
- On-the-books (OTB) business for upcoming dates within the month
Use this tab to monitor:
- Current month pacing
- Month-to-date performance
- Daily operational activity
This Month + Next Two Months
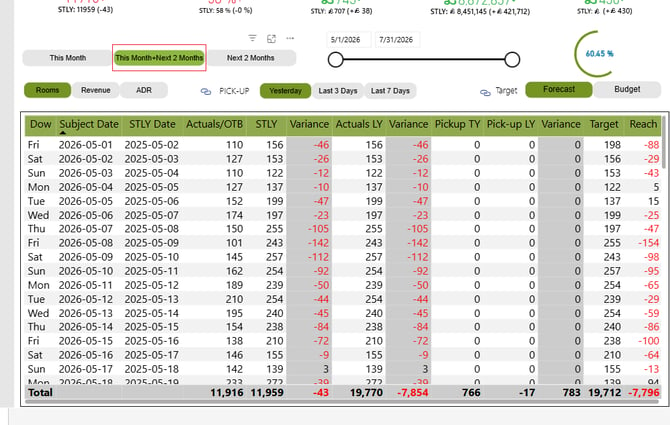
This tab combines:
- Current month actualized data
- Future on-the-books data for the next two months
Use this tab for:
- Short-term forecasting
- Revenue pacing analysis
- Future booking visibility
Next Two Months
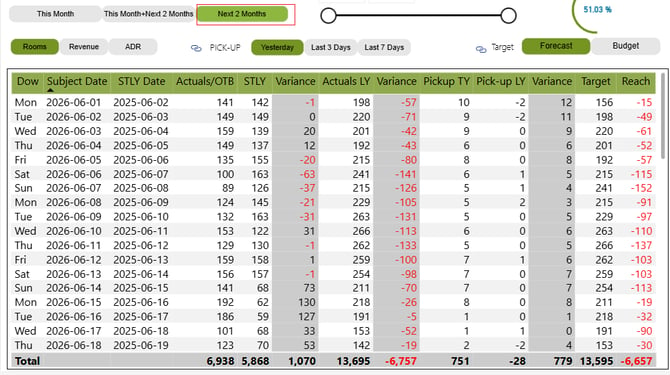
This tab focuses only on future business and displays:
- On-the-books reservations
- Future occupancy trends
- Future revenue outlook
Use this tab to:
- Analyze future demand
- Review upcoming occupancy levels
- Monitor future revenue opportunities
Key Metrics Included
The dashboard provides visibility into several important hotel KPIs.
Rooms Revenue
Displays total rooms revenue for the selected period.
ADR (Average Daily Rate)
Shows the average room rate achieved during the selected timeframe.
Occupancy
Displays occupancy performance based on rooms sold versus available inventory.
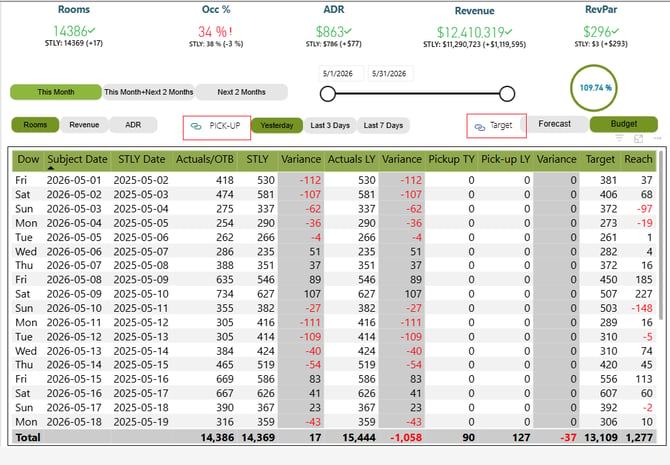
Pickup Metrics
Pickup metrics help track how bookings have changed over time.
Available pickup views include:
- Yesterday Pickup
- Last 3 Days Pickup
- Last 7 Days Pickup
Forecast and Budget Tracking
The dashboard compares your hotel’s performance against:
- Forecast
- Budget
- Last Year
This allows users to quickly identify:
- Whether the hotel is pacing ahead or behind expectations
- Revenue gaps or opportunities
- ADR performance trends
Reach-to-target percentages are also displayed for easier tracking.
Interactive Navigation
The dashboard includes clickable links that allow users to drill into more detailed reporting.
Pickup Dashboard
Provides a deeper analysis of:
- Booking pace
- Pickup trends
- Historical pickup behavior
Forecast and Budget Dashboard
Provides additional visibility into:
- Forecast and Budget comparisons
- Forecast and Budget analysis
- Revenue target tracking