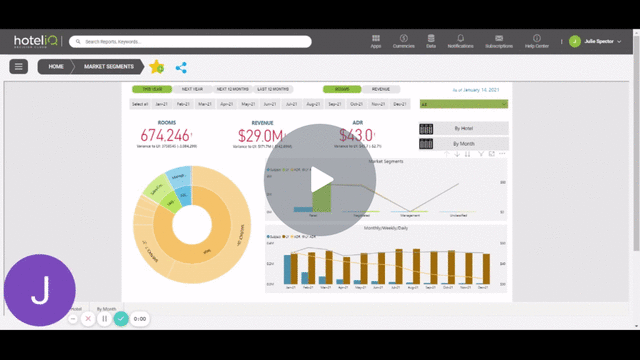
HotelIQ’s dashboards allow users to see high level KPIs for one or more hotels across a range of dates, with the ability to dive deep into the data. Click on any graph on a dashboard to view a variety of drill mode options.
Toolbar Features - Watch Video


Drill up or down to see the next level in the hierarchy for one field at a time.
Drill down all fields at once

Drill down to the next level in the hierarchy for all fields at the same time.
Filters and slicers affecting the visual

Any filters or slicers impacting the display of the graph.
Focus mode

Focus mode to expand a visual to see more detail.
More Options:

Export Data: Export summarized or underlying data to Excel format
Show as Table: Displays summarized data in tabular format
Sort Ascending/Descending/Sort By: Sort data by ascending/descending order, or by any of the available metrics
Multi-select time slicers and filters


Hold down the Ctrl key to select multiple time slicers or filters at the same time
For more information on Microsoft Power BI Dashboards, please read here