
By: Sameer Umar, Vice President, Operations & Customer Success
As providers of the leading Business Intelligence (BI) and Analytics platform for the hospitality industry (HotelIQ), at Intelligent Hospitality we’re often asked to replicate existing reports that hotels produce manually. The thinking behind such a request is understandable:
“My hotel spends X hours producing reports at regular intervals (usually daily, weekly, or monthly). We like these reports. If they can be automated by a tool, that would save us a lot of time.”
While on the surface, that logic is reasonable, it completely misses the advantages of analytics solutions. More importantly, it highlights a big gap in our thinking and approach towards analytics in the hotel industry. If you are making the decision to move on to more sophisticated technology, it is important to understand and leverage all its benefits. Not just to get a substantial ROI out of it, but to be able to compete in today’s market.
My grandfather loved his typewriter and never used a computer. According to him the only reason to switch from a typewriter to a computer would be to get clearer print. A computer was too expensive to do just that, so he never bought one.

We all understand today (hopefully) that the ability to type and print is the least of a computer’s capabilities. We look for speed, memory, connectivity, and overall computing power when we are in the market for a computer. In fact, it is inconceivable that someone could survive in today’s job market without basic know-how about computers.
Similarly, with the information era in full swing, hoteliers who don’t “get” analytics solutions won’t be able to compete in a market full of data-savvy OTAs and rental alternatives like Airbnb. These new players have already mastered data analytics; They live and die by it.
If you still think it’s “just reporting”, I have taken up too much of your time already. This article is intended as a starting point for those hoteliers who want to take a more analytical approach to their business.
If you’re still reading, I promise this will be more fun than it sounds. However, just to test your commitment, I will start with something dry…
Definitions
Here is how Adobe defines Reporting and Analytics respectively:
Reporting is “the process of organizing data into informational summaries in order to monitor how different areas of a business are performing.”
Analytics is “the process of exploring data and reports in order to extract meaningful insights, which can be used to better understand and improve business performance.”
You don’t have to memorize these definitions. Just remember one thing – reporting is “monitoring” while analytics is “exploring”.
When we run day to day meetings using templatized reports, we condition ourselves to look for and monitor specific cells/fields – day after day, week after week, month after month. We only react when we see a significant fluctuation in those values, and even then, we must wait for an analyst to go and get us the answer to our next question. It’s a slow and reactive process. Yet, it’s familiar and comfortable.
Analytics on the other hand, is driven by curiosity, competitive drive, and a sense of adventure. It gives us multiple views and perspectives by dimensionalizing data. It takes us on a journey of discovery by giving us the ability to answer questions on the go. Thus, it expedites the discovery of opportunities and threats while minimizing surprises.
Visualization
Looking at familiar designs and layouts makes our eyes dull to minor changes. Hence, we don’t see what we don’t expect to see. Here’s a rose:

What if I told you that there is a dolphin inside the rose? Can you find it? Hint: Take a closer look at the petals.
I hope you were able to find it. However, I doubt anyone would have noticed it had I not pointed it out.
A wall of numbers in a spreadsheet is no different. You see rows and columns populated with figures. Unless you know what to look for, it’s hard to see it.
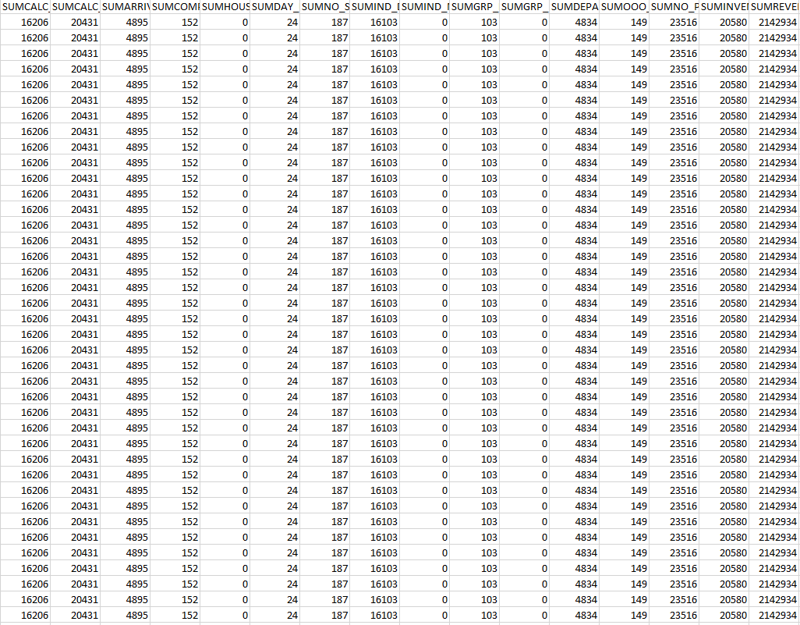
Good data visualization should not just be pretty, it should draw your attention to what needs your attention. To be able to do that, you must crunch huge amounts of data, contextualize, compare, and conditionally format. And that’s just the basic stuff you should expect from your BI/Analytics solution.
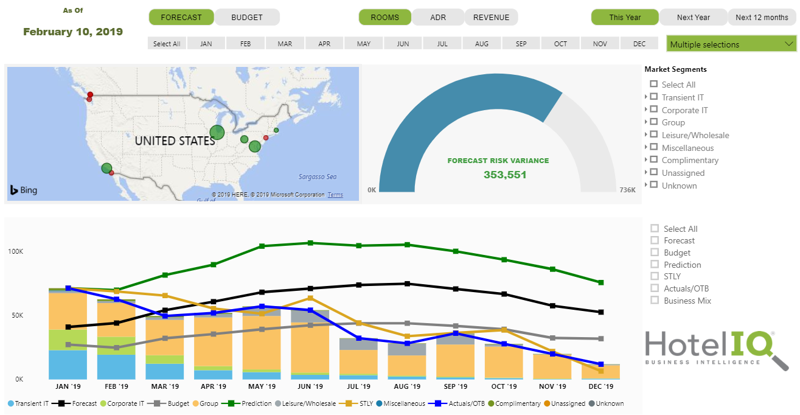
The above dashboard consolidates a ton of information. It includes data by hotel, by month, and by market segment – actuals, OTB, STLY, Budget, and Forecast. Plus, based on current and historical trends, it also estimates where you are likely to finish against your goals. Yet, it only needs three simple visuals to convey all that information and more. The goal is not to bombard you with information, but to highlight what’s most relevant.
Interactivity
Looking at the map, you know right away which hotels in which markets need attention. The color and size of the bubbles can change instantly to indicate the risk levels based on various parameters. It becomes even more engaging and meaningful as you easily zoom in, filter, and dissect the underlying cause(s). All this momentum and insight with just a few clicks!
In contrast, with a typical report produced manually by the hotels and consolidated at the corporate office, users would either make due with an aggregate figure or painfully (depending on the size and scale of your operation) go over each hotel one at a time. Even when you are looking at a single property there are many dimensions like market segments, profiles, feeder markets, channels, and room types that you have to look into and consider in order to make the right business decisions.
And should you have any further questions…like Adobe says, reports are for monitoring, not exploring. That is the fundamental reason why reports don’t translate well into an analytics environment. They are restrictive because they are built using simpler tools with lower technical complexity. When you transpose those reports into an analytics environment they often bring along with them the limitations of their original design.
Effort and Opportunity
A lot of hotels have Excel junkies on staff who copy & paste data from various sources, run macros, build pivot tables, and go through data gymnastics every day to lay out the information in a manner the GM likes. They love these “spread-marts” because they have birthed them at their hotels. So please forgive me if it sounds like I’m calling your baby ugly. However, no matter how much you master these basic tools, they are no match for the BI tools used by Data Scientists (with degrees in Computer Science and Data Analytics) to design robust analytics solutions.

My neighbor can grill a mean steak on the BBQ in his backyard but that doesn’t mean you should trust him to run a commercial kitchen. It’s nothing against steaks, BBQ, or my neighbor. We understand that a trained chef in a professionally equipped kitchen can do a lot more with the same ingredients.
A hotelier’s job is to optimize profits at the hotel while ensuring that guests get the best experience possible. The hotel staff should be focused on the achievement of those goals rather than toiling with data for hours – just to create a report. What you get at the end of the day may be familiar but is also probably outdated information and subject to human error. Instead, if the same talent that produces reports focused on discovery and insight using the latest BI and Analytics solutions, you’d go much further.
Start Exploring
The objective of this article is not to put reports down. In fact, reports are an important part of analytics. But hotels need to elevate their standards towards analytics. Stop asking your BI solutions to give you more of the same. Stop staring at the same rows and columns waiting to see different results. In this age of information, data fuels success. If you want to stay relevant, challenge yourself to go further with data analytics. To help you achieve that, in the coming months I will be taking a more tactical approach to discuss topics related to hotel analytics like improving your hotel’s forecast with the help of analytics, optimizing the performance of hotel sales team with data analytics, and using analytics to run more productive meetings at your hotel.

Comments