
HotelIQ Welcomes InterContinental Toronto Center
Read MoreTo truly understand what’s happening at your hotel, portfolio, or management company, you need to sift through a lot of data. Big data can yield powerful insights, but the challenge lies in structuring that data in a way that’s easy to interpret and act on. For hoteliers who are ready to take the next step toward more data-driven decisions, a business intelligence platform can deliver tremendous value. But most BI tools aren’t designed with hotels in mind, so their utility is limited when it comes to commercial organizations in the hospitality industry.
In this article, we’ll review a BI tool created by hoteliers, for hoteliers: HotelIQ. Through this review, we’ll introduce you to HotelIQ’s suite of features and reports so you can assess whether it might be a good fit for your business.
Introduction to HotelIQ’s New Decision Cloud
HotelIQ’s goal is to help hoteliers organize data, analyze it, plan next steps, and collaborate with their team and across their organization. In doing so, HotelIQ aims to give hoteliers the lenses they need to pull insights from big data and make more intelligent decisions. This focus on decision-making is why HotelIQ dubbed their newly launched analytics suite “Decision Cloud,” which is an upgrade from their legacy interface in terms of both functionality and user experience.
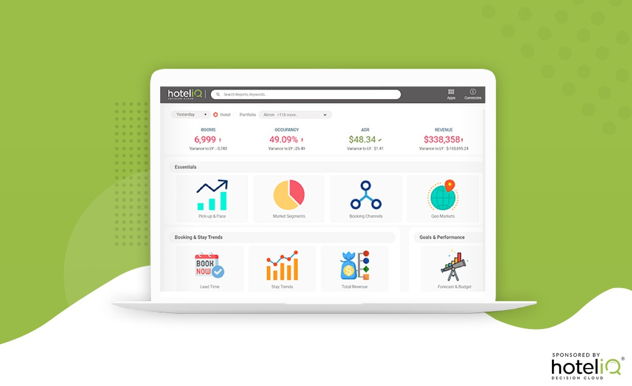
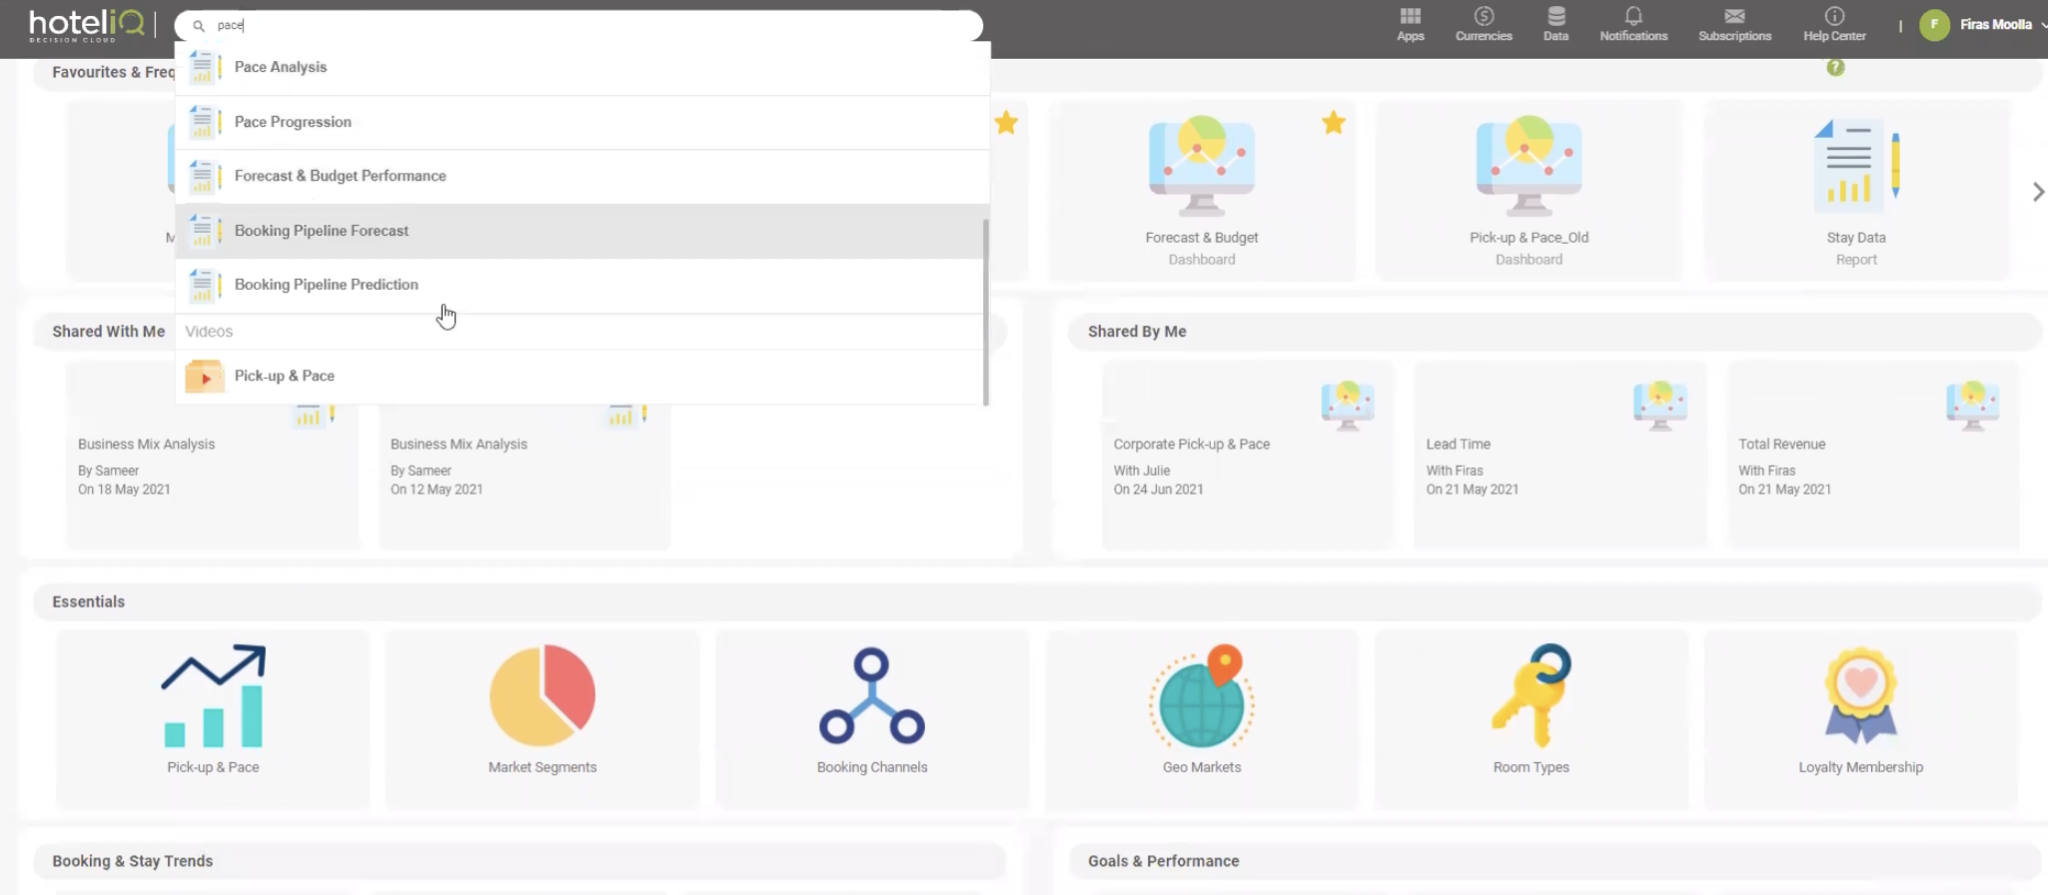
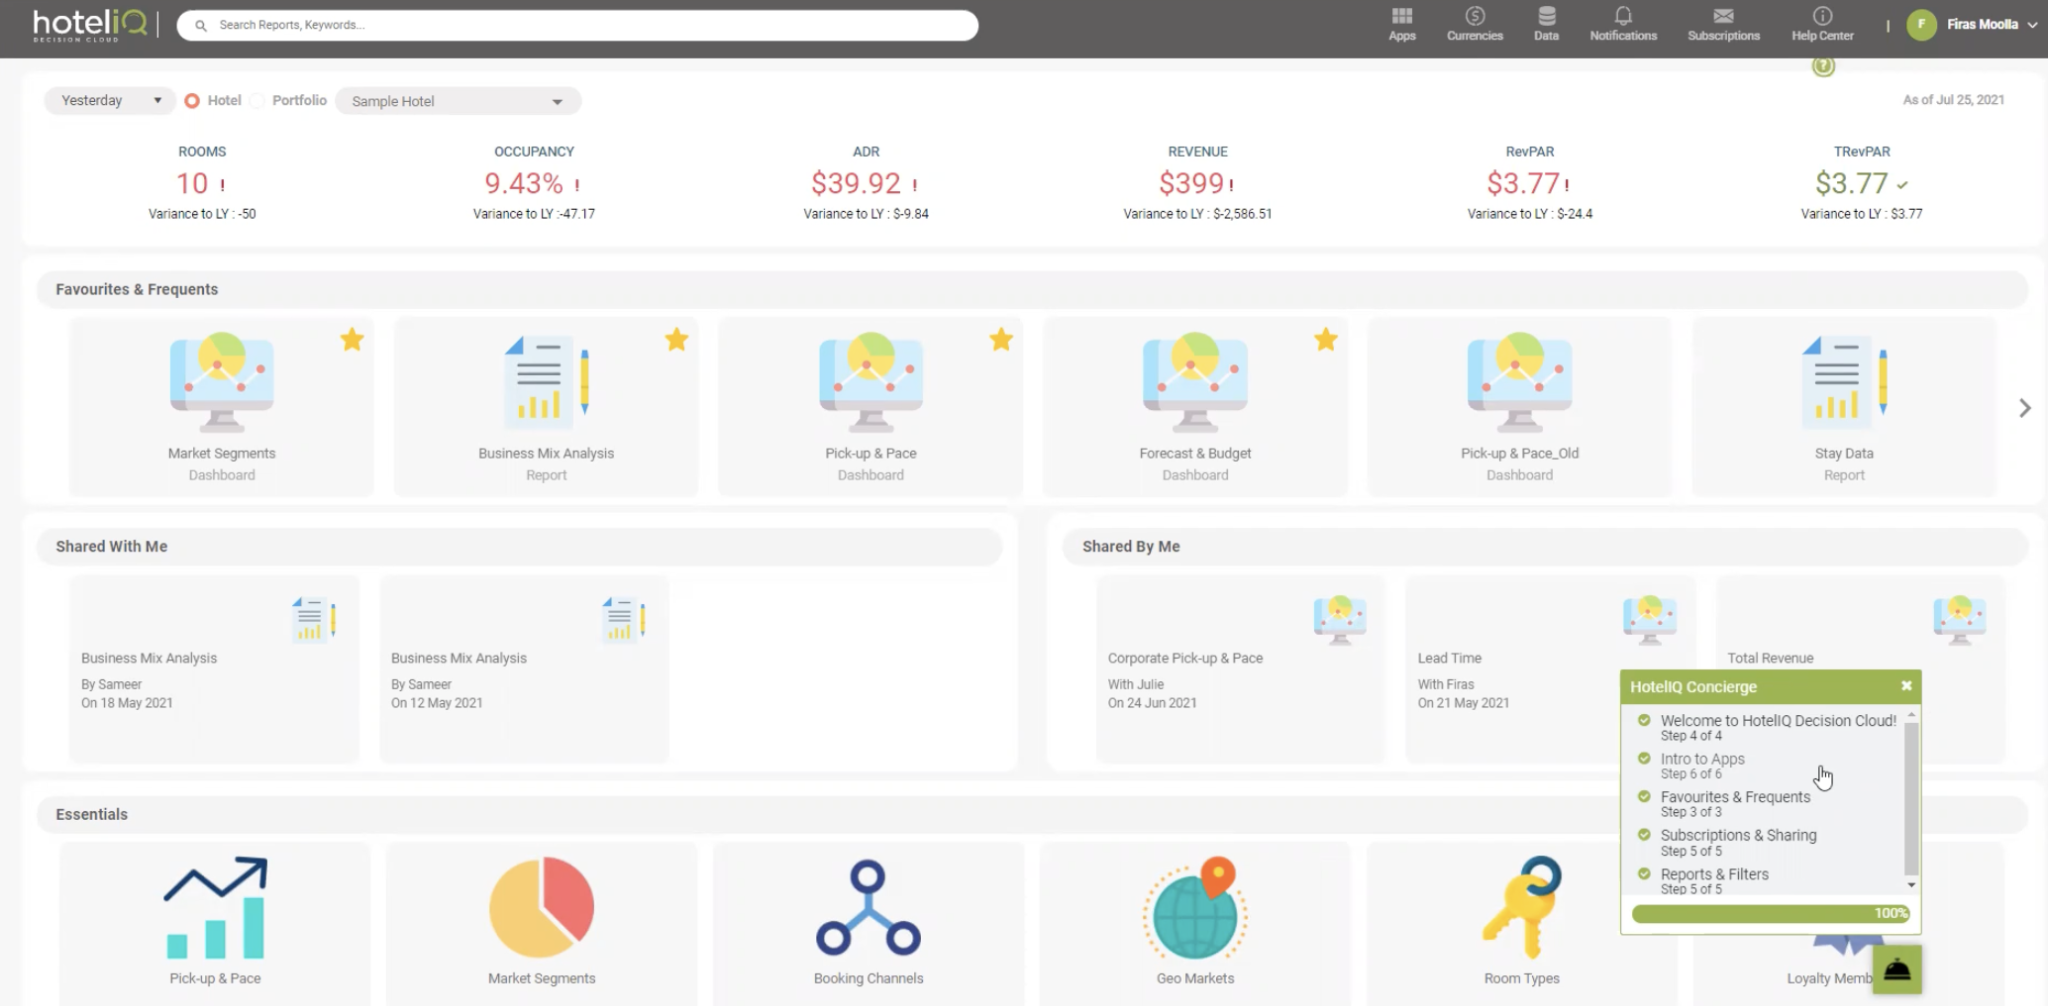
The newly launched Decision Cloud takes a much more visual approach, looking more like the home screen on an iPad. A notable addition is the search bar, which enables users to search for key reporting terms they’re looking for, like “pace” or “booking channels.” Reports matching the search criteria will appear.
Within one app, HotelIQ houses all of your hotel data, which is fed directly from your PMS. Thinking long-term, HotelIQ can save time by eliminating the need to create your own reports in Excel and reducing email volume; its interface is a single source of truth for staff members on-site and remote. A world with fewer weekly meetings and no manual report pulling is closer than you might think.
Analyze: Dashboard and Reports
The hallmark feature of HotelIQ is its reporting suite; this library of dashboards and reports puts the most commonly used data at your fingertips. This module is most useful for revenue managers and sales managers, but general managers and operations managers can benefit from insights gleaned from these reports too.
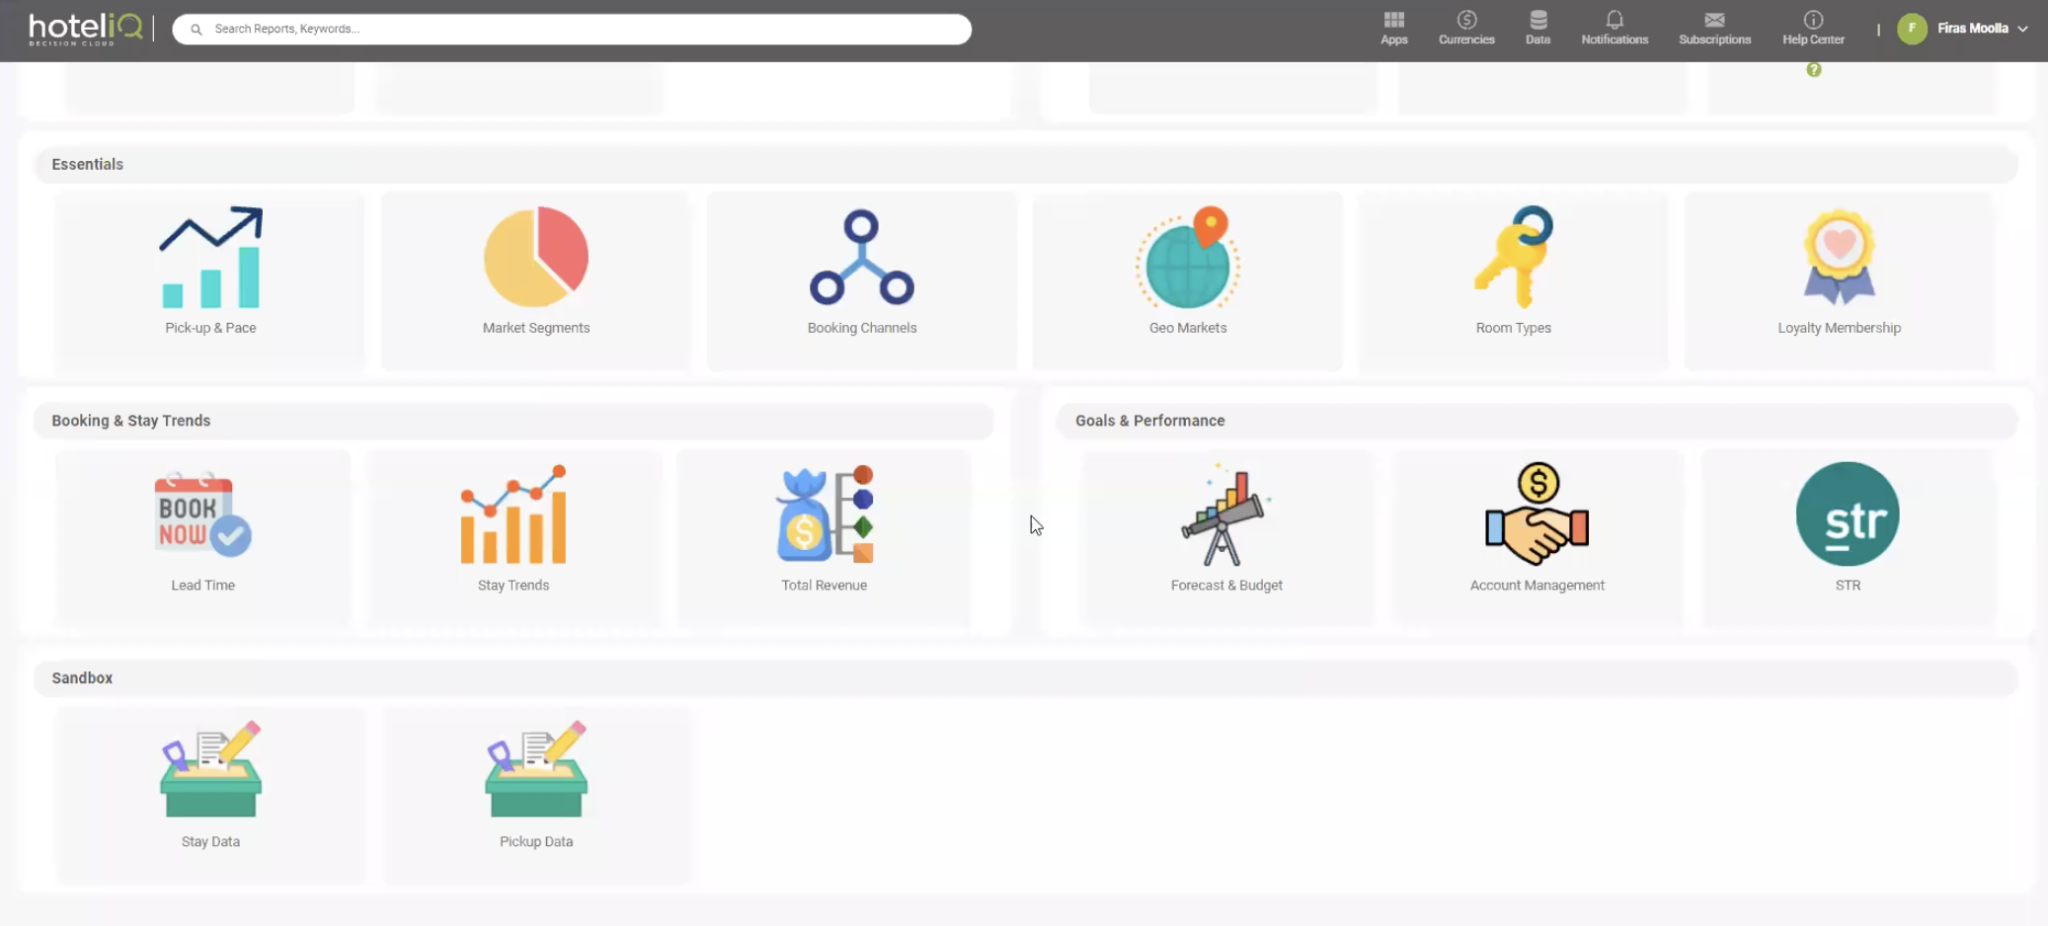
The dashboard library includes visualizations for pick-up and pace, market segments, booking channels, geo markets, and more. HotelIQ subscribers might also add modules for account management and a STR integration, which aren’t included with the most basic package.
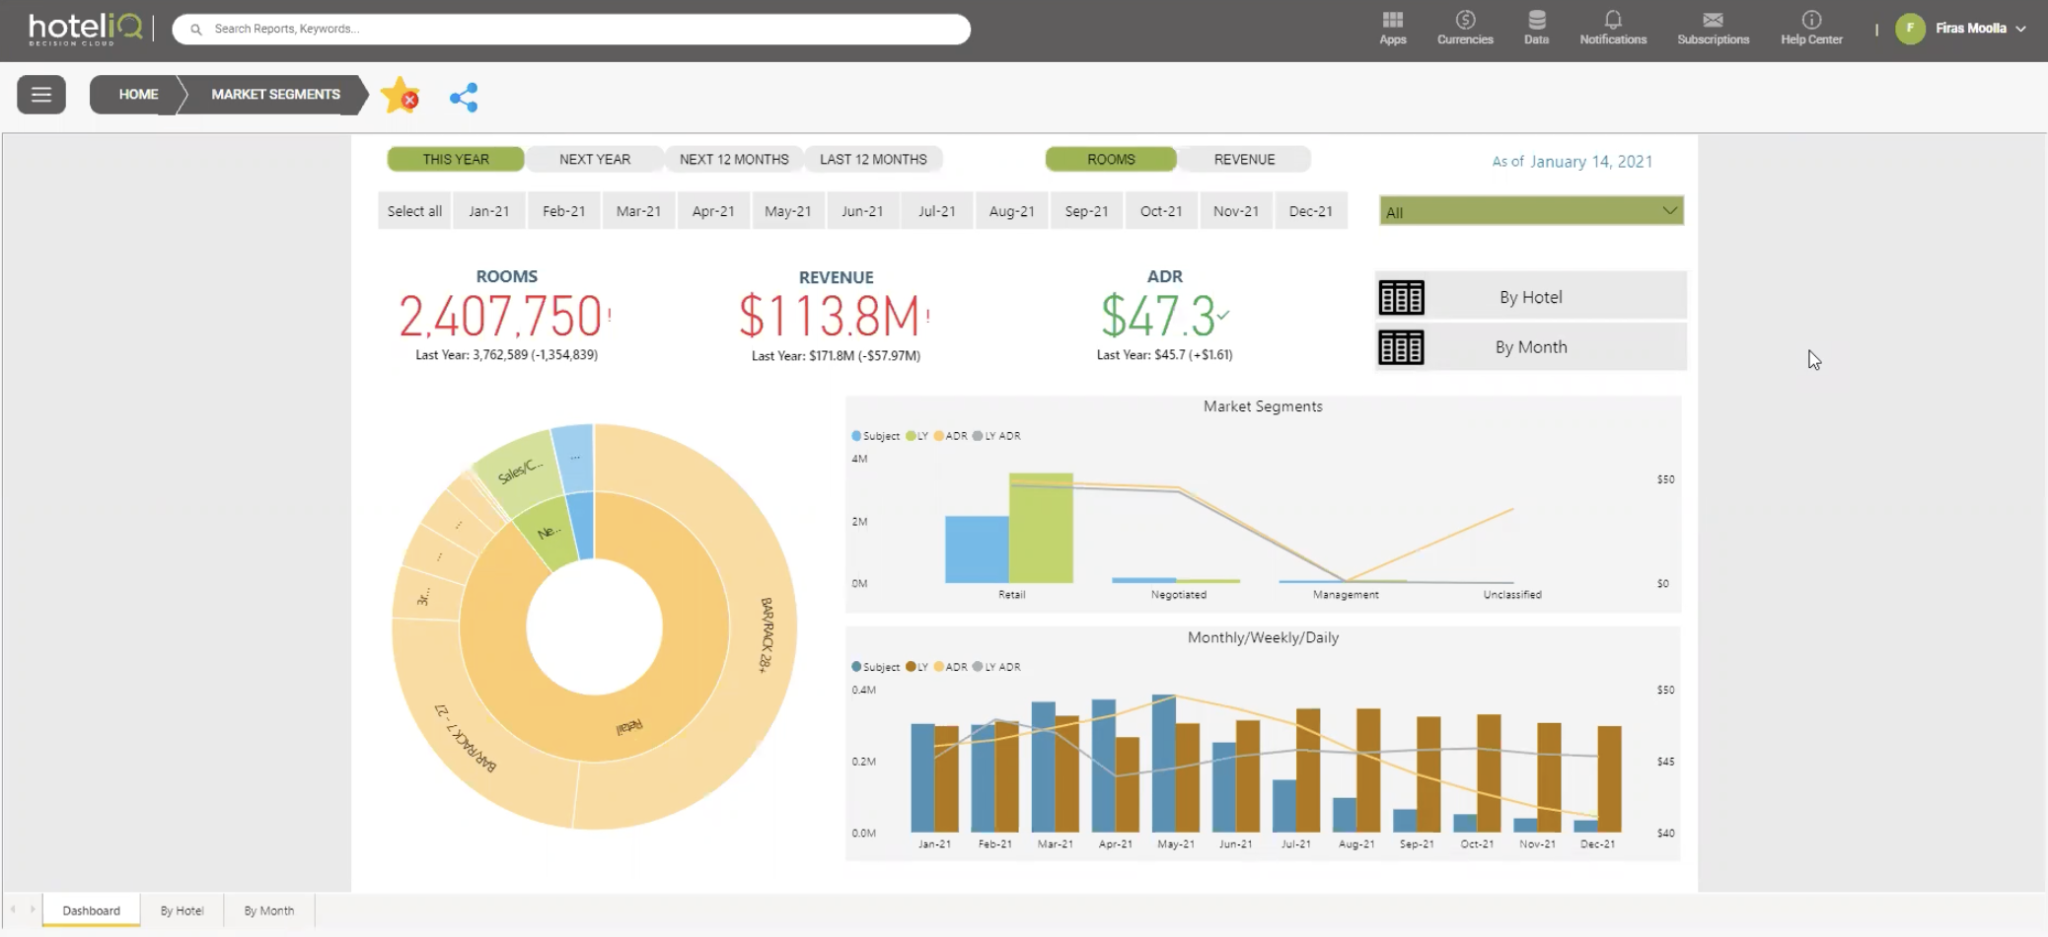
By clicking on one of the tiles on the home screen, you’ll land on a Dashboard. In this example, we see the Market Segments dashboard. Dashboards are quite visual - you’ll see charts and graphs with the ability to filter by hotel, hotel group, and date range. The goal of the Dashboard is to make the data accessible and easy to understand even for team members outside of the revenue management or sales teams who might be less comfortable with data.
In addition to the Dashboard visualizations, you can see the raw data in a standard table format.
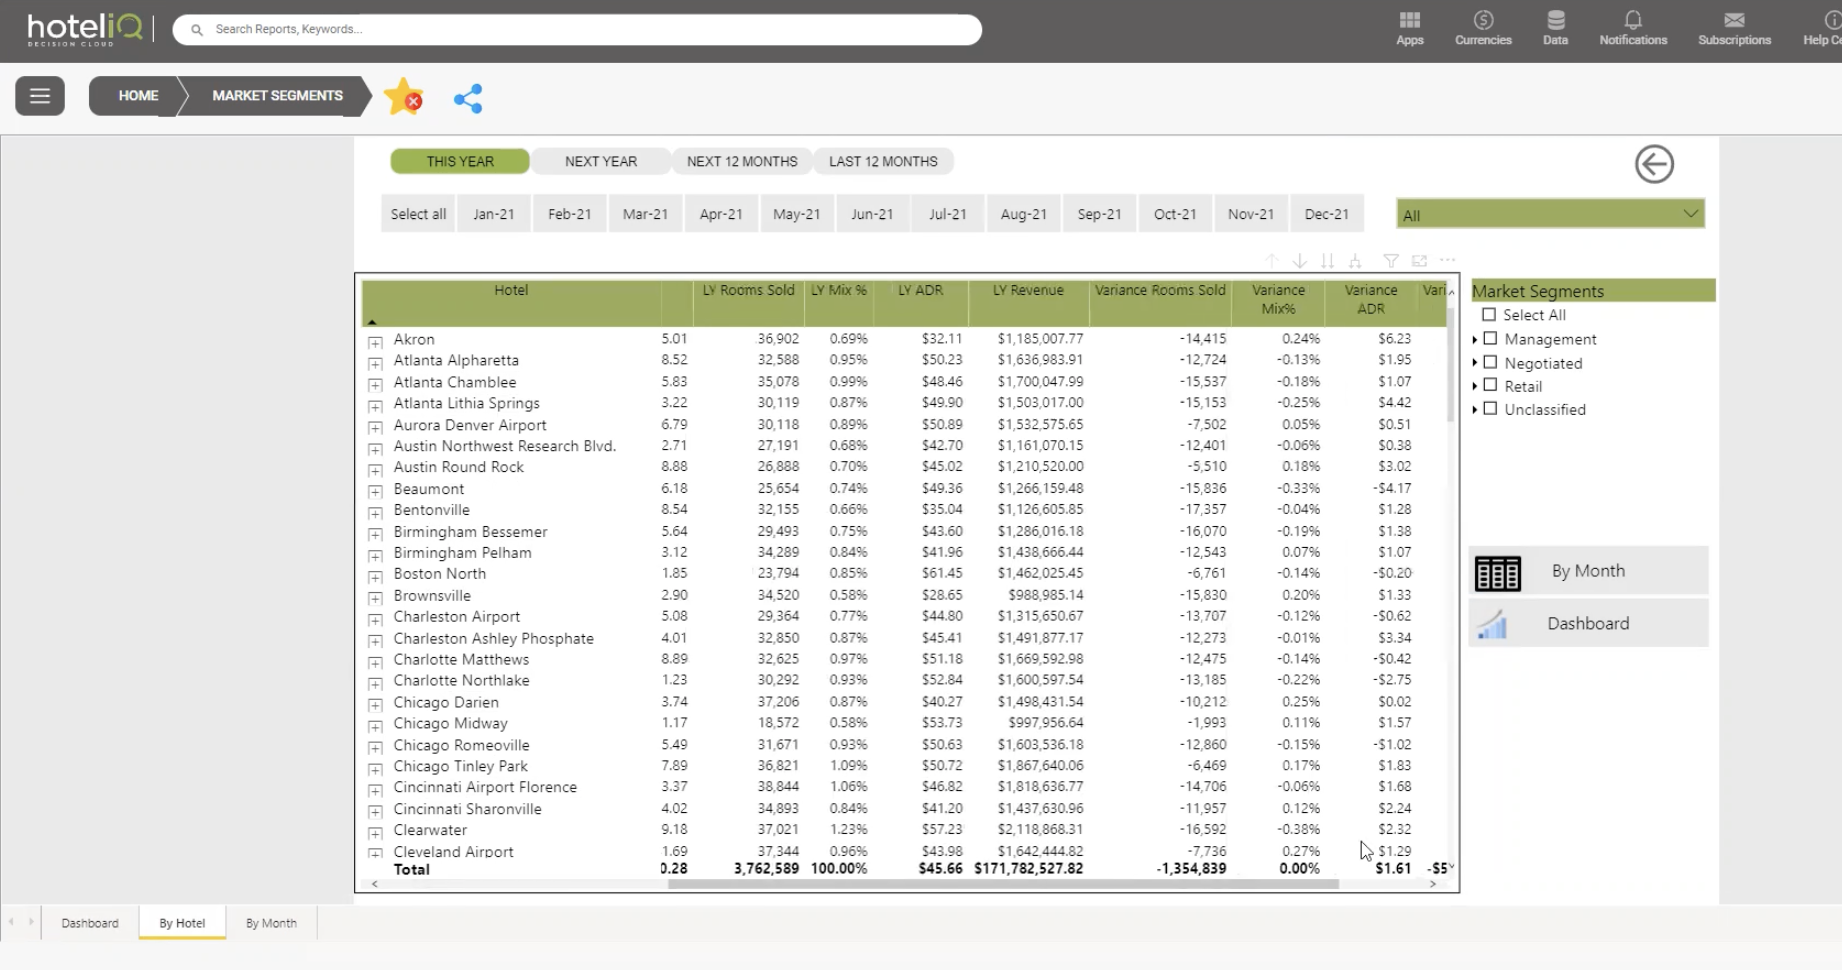
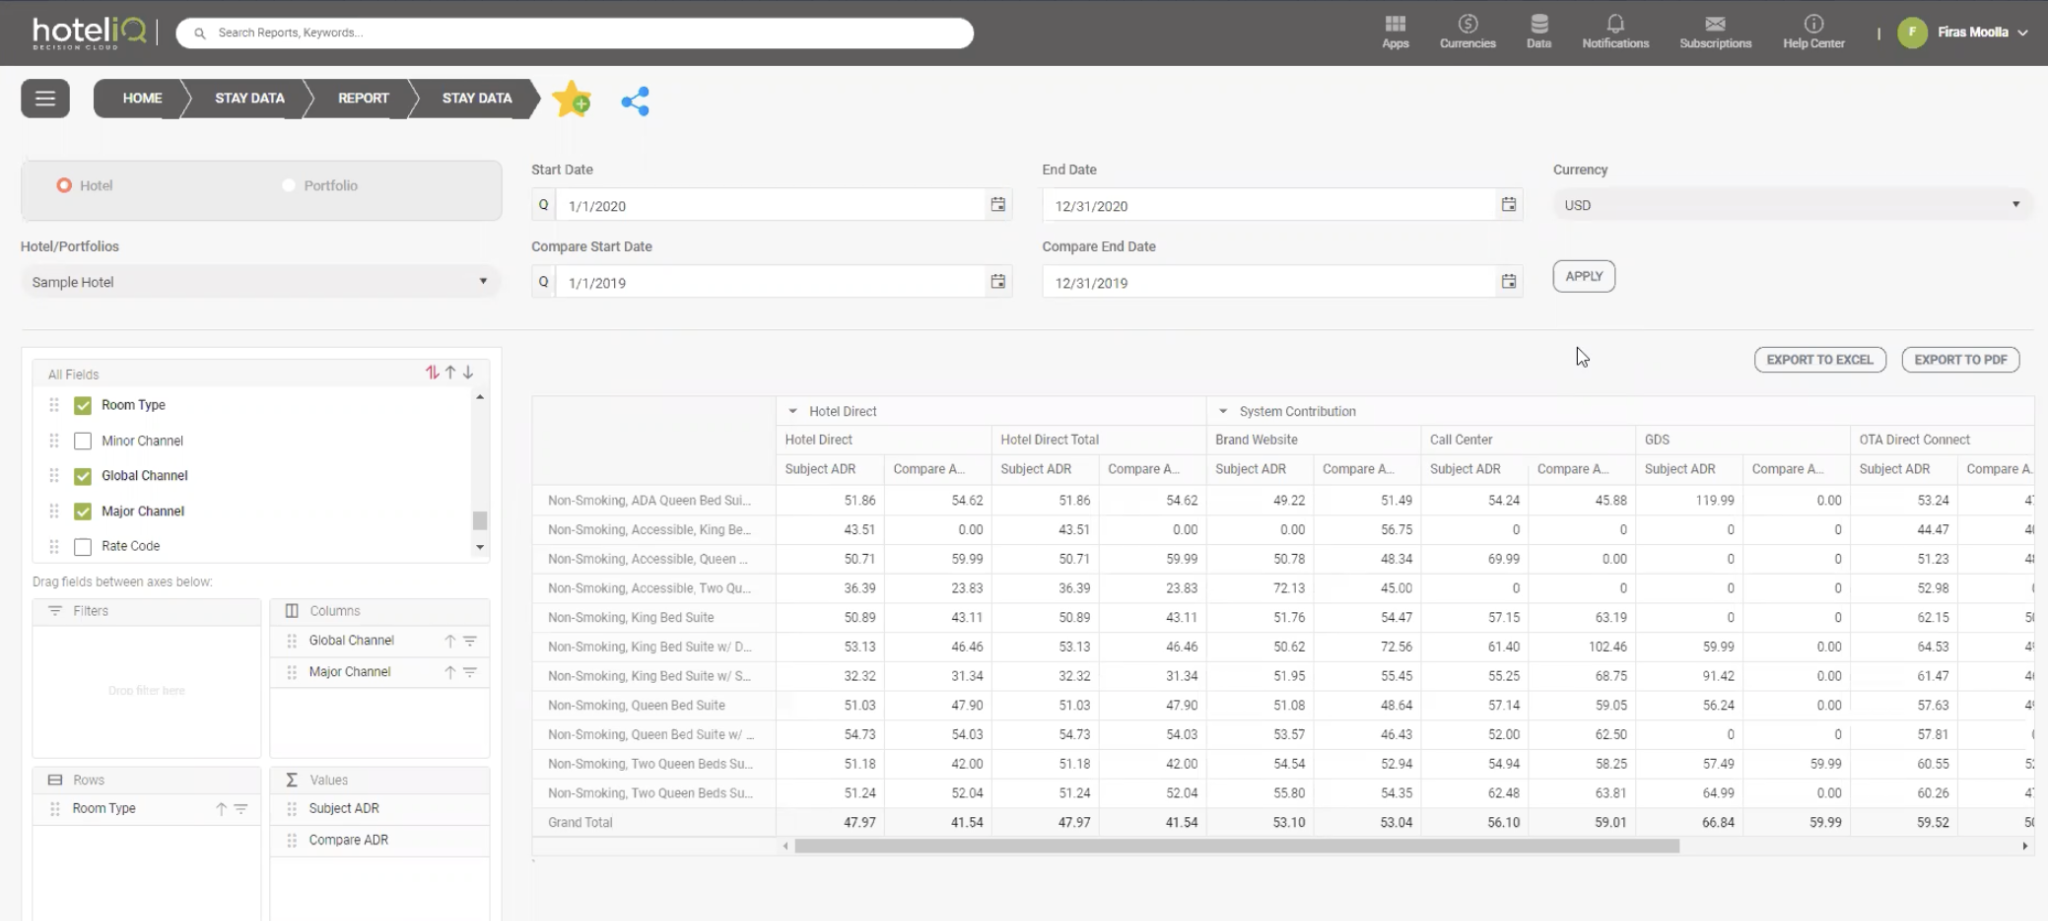
To get more granular, you can select from a few Reports that slice data from the Dashboard in different ways. Reports have more filters than Dashboards, which allow you to dig into exactly the data you want. You can filter by room class, distribution channel, loyalty membership, and more.
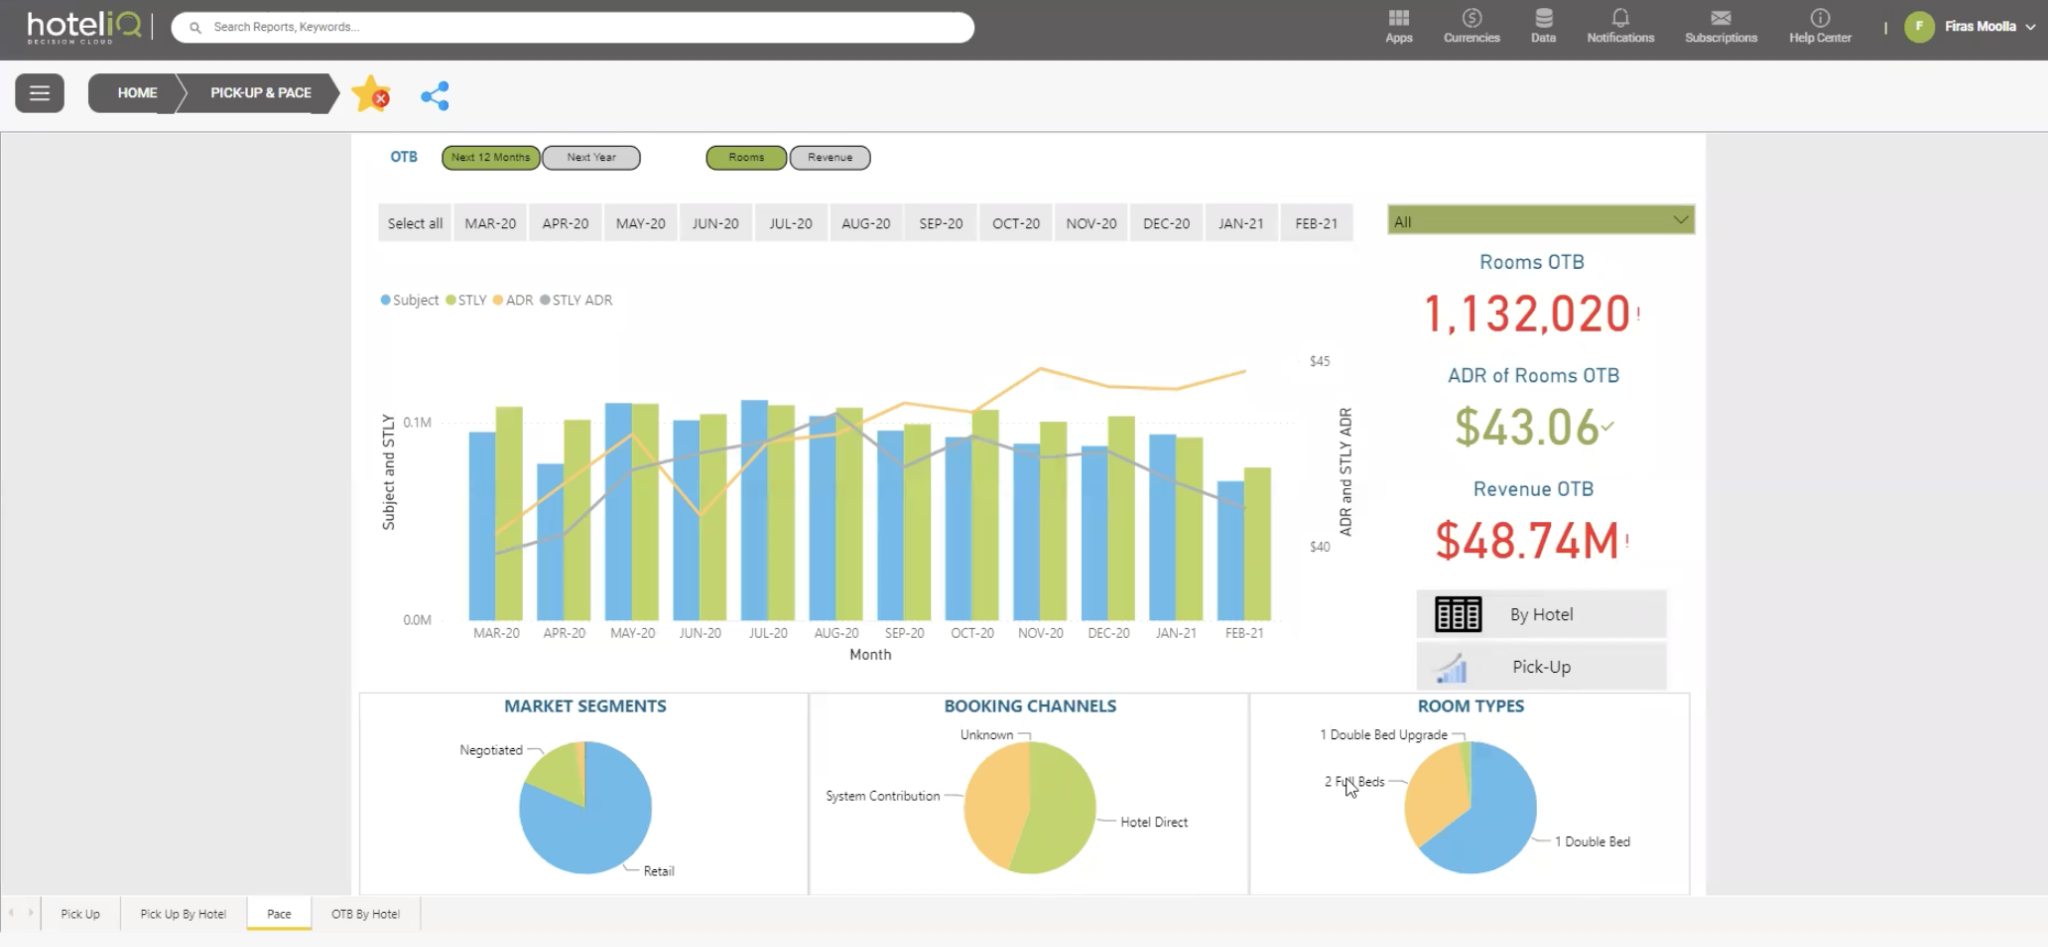
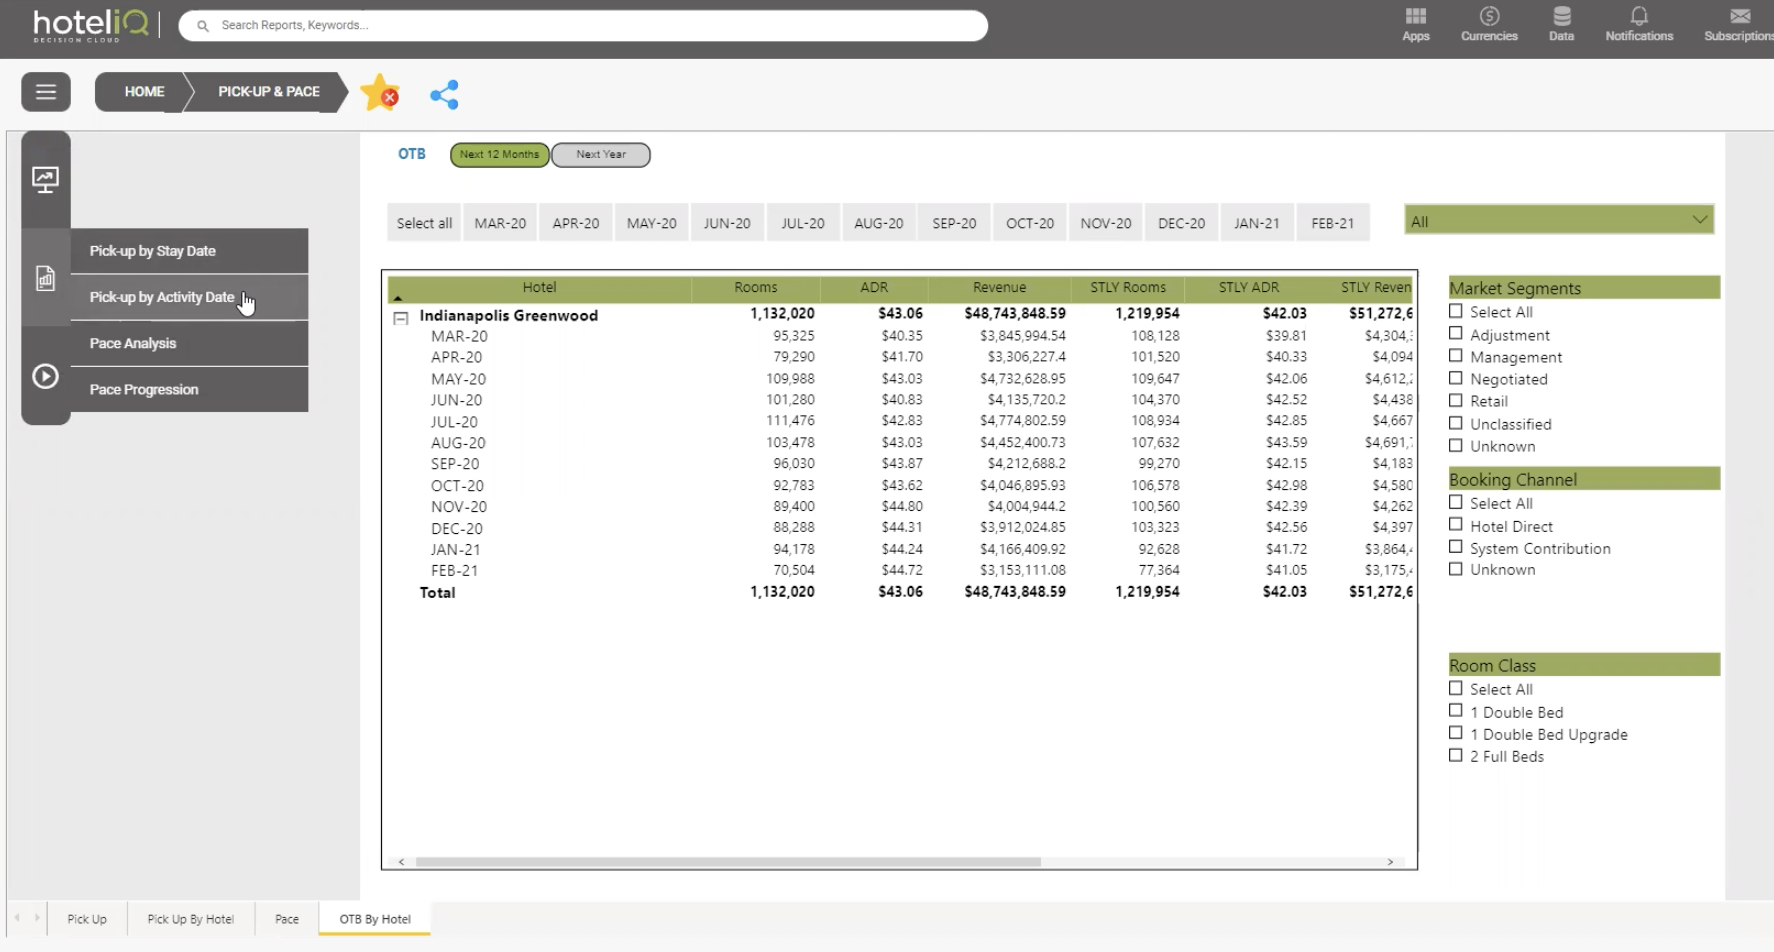
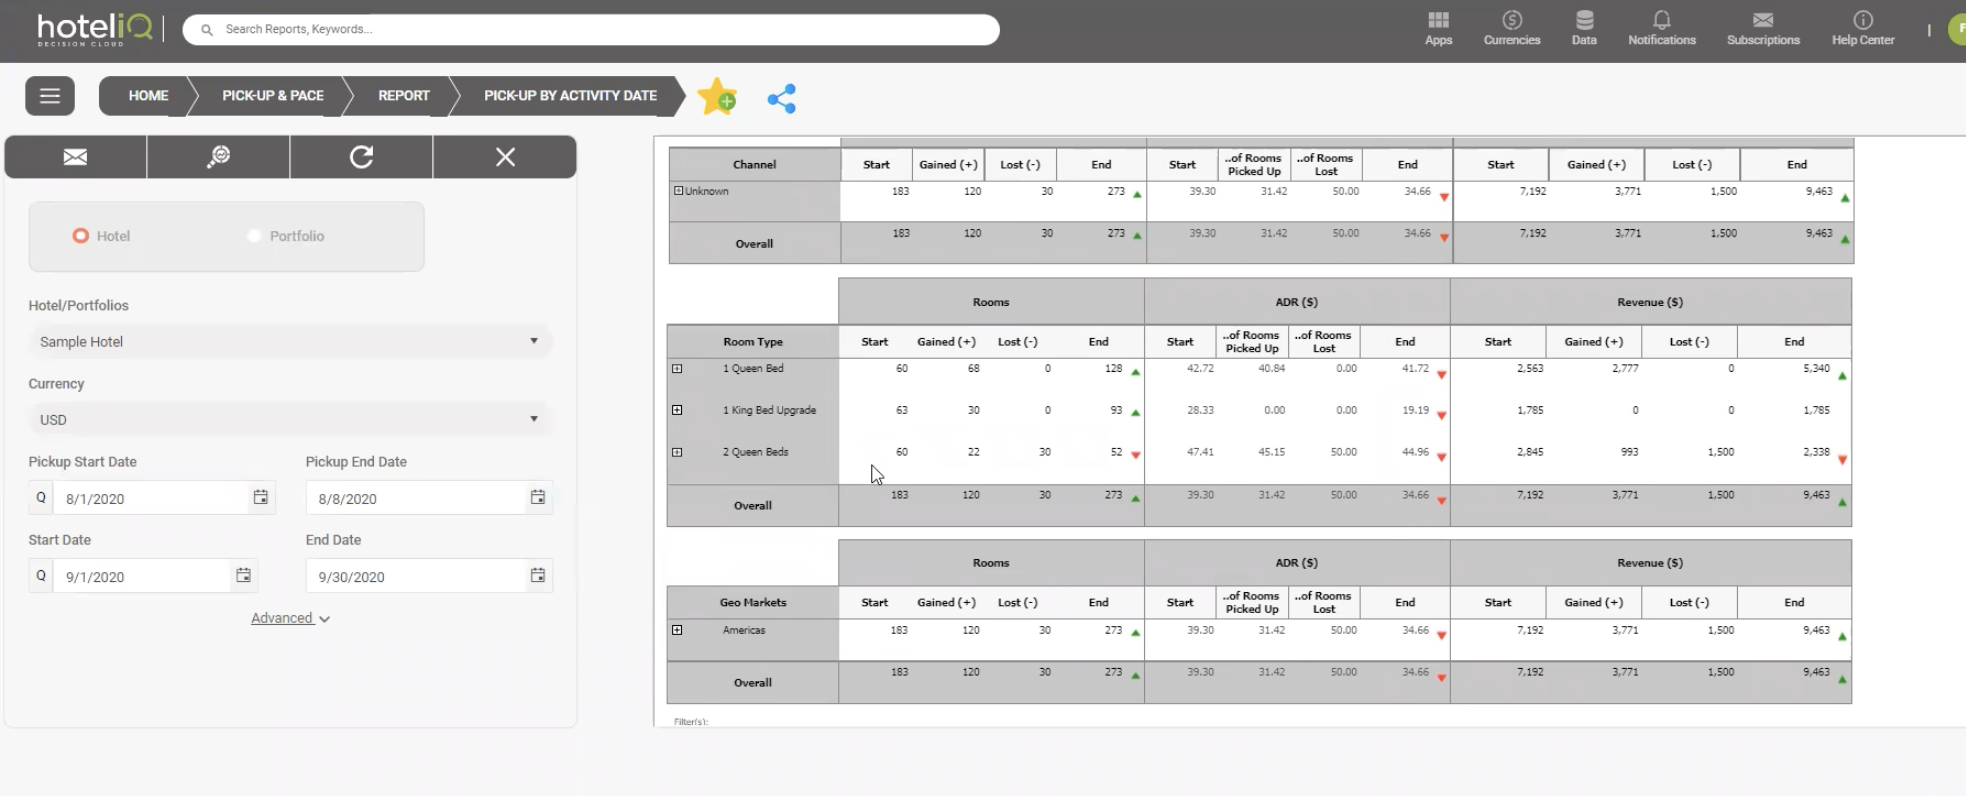
Besides the Market Segments dashboard, another frequently used dashboard is the Pick-up and Pace dashboard. This one is a favorite of revenue managers and sales managers, who will appreciate the ability to filter the reports by account name or market segment in addition to the standard hotel name and date filters.
The Pick-up reports can be pulled by either book date or stay date, and you can drill down to the rate code level to study performance at the most granular level.
You can also pivot this report to see pick-up by room type, distribution channel, feeder markets, and more.
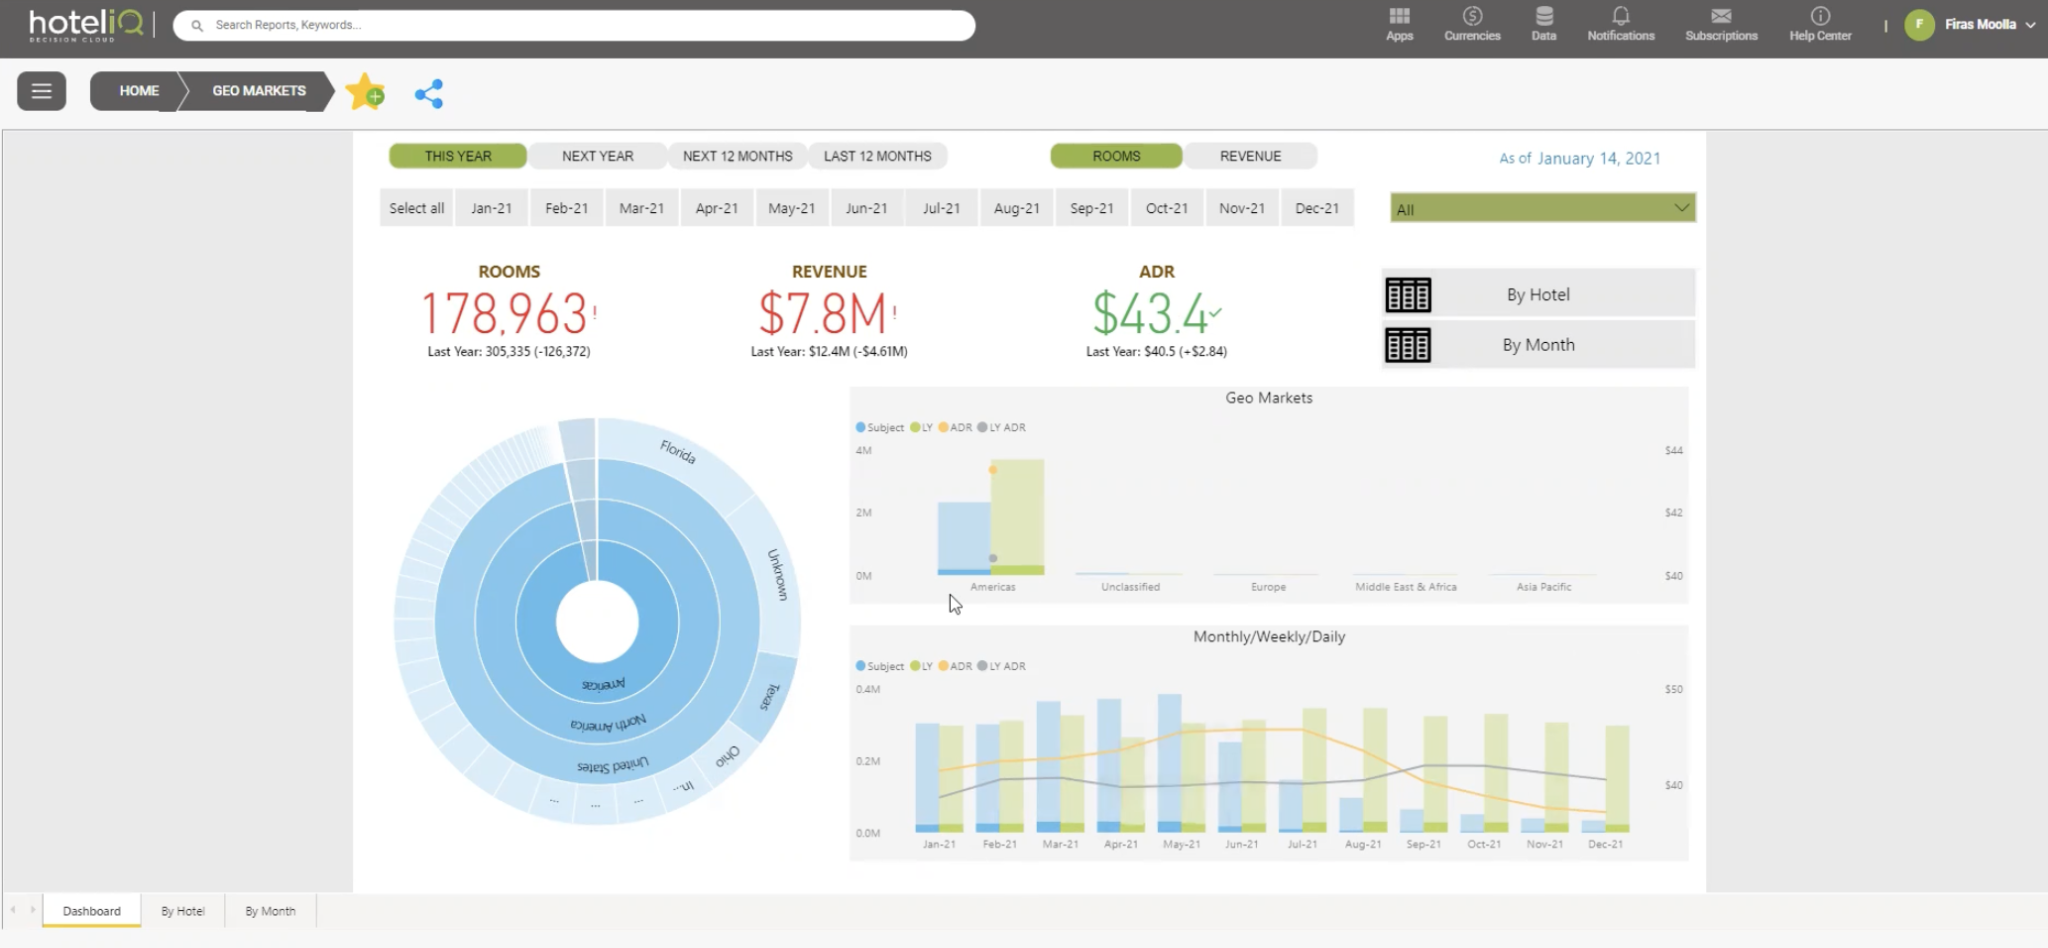
The Geo Markets dashboard is typically used by revenue and sales teams, but marketing managers might also uncover interesting trends around seasonality and variances by location, especially for management companies who operate in many markets.
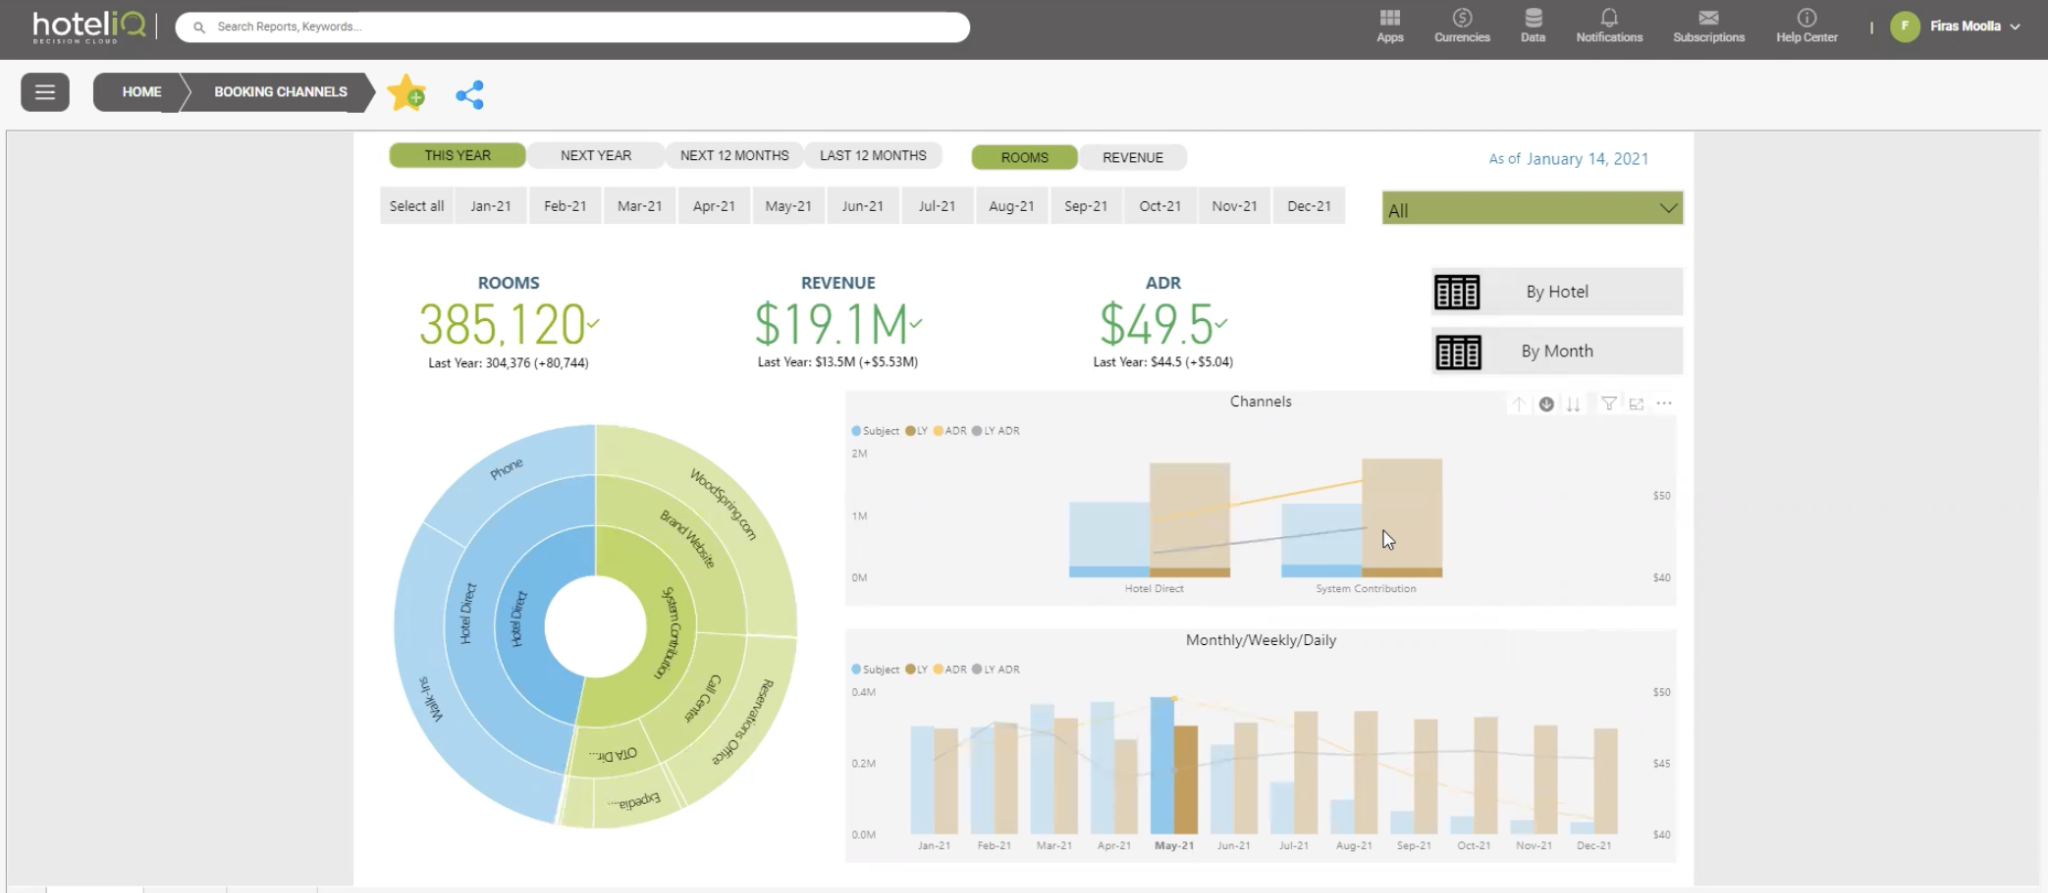
The Booking Channels dashboard highlights production on not only third-party channels but also sub-segments of your direct channel, like comparing phone reservations and walk-ins to website bookings.
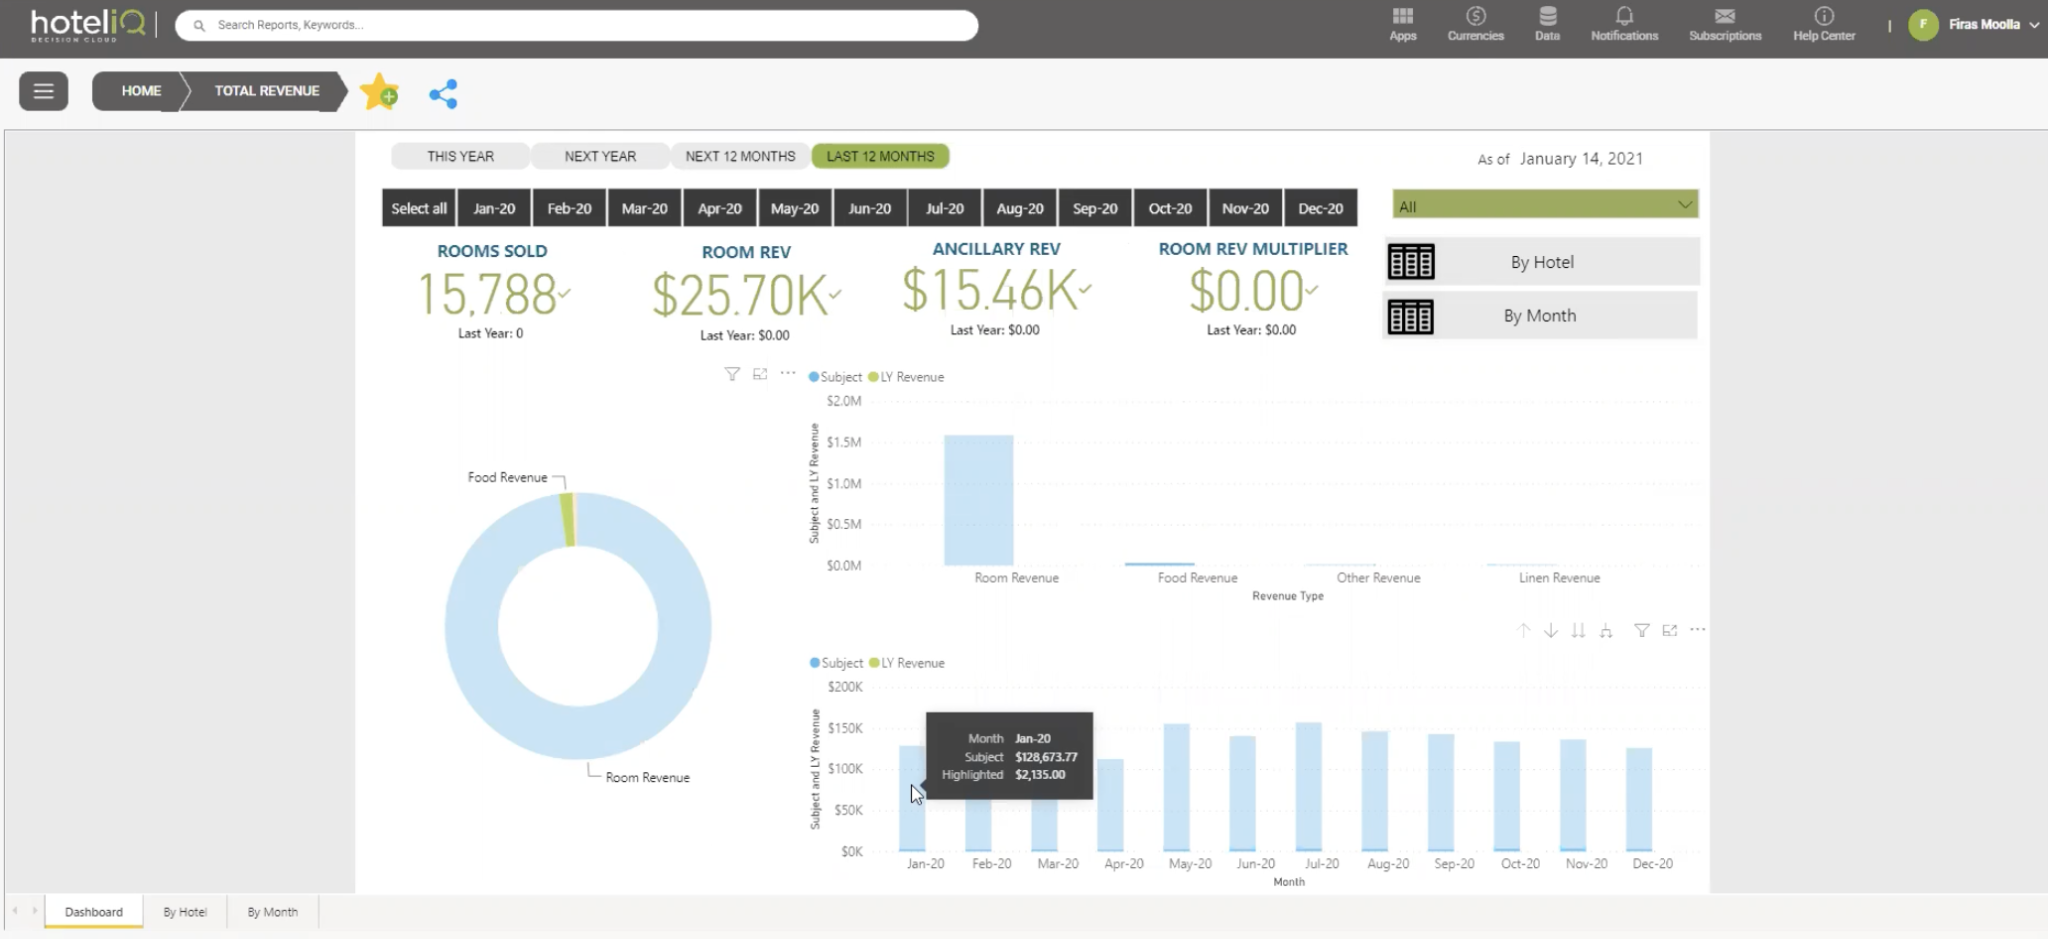
You can take a big-picture look at hotel performance on the Total Revenue dashboard, which splits out revenue by operating department, like rooms and F&B. While most of HotelIQ’s reports are most useful to revenue management or sales, this one can be relevant to operations teams, general managers, and even owners who want to understand performance of individual properties or revenue streams.
Many HotelIQ subscribers use their STR integration, which pulls in your STR data and compares your fair share to your forecast, automating some analytics you would have otherwise needed to do manually in Excel. HotelIQ can also submit your daily, segmented data to STR on your behalf, for further automation and time savings.
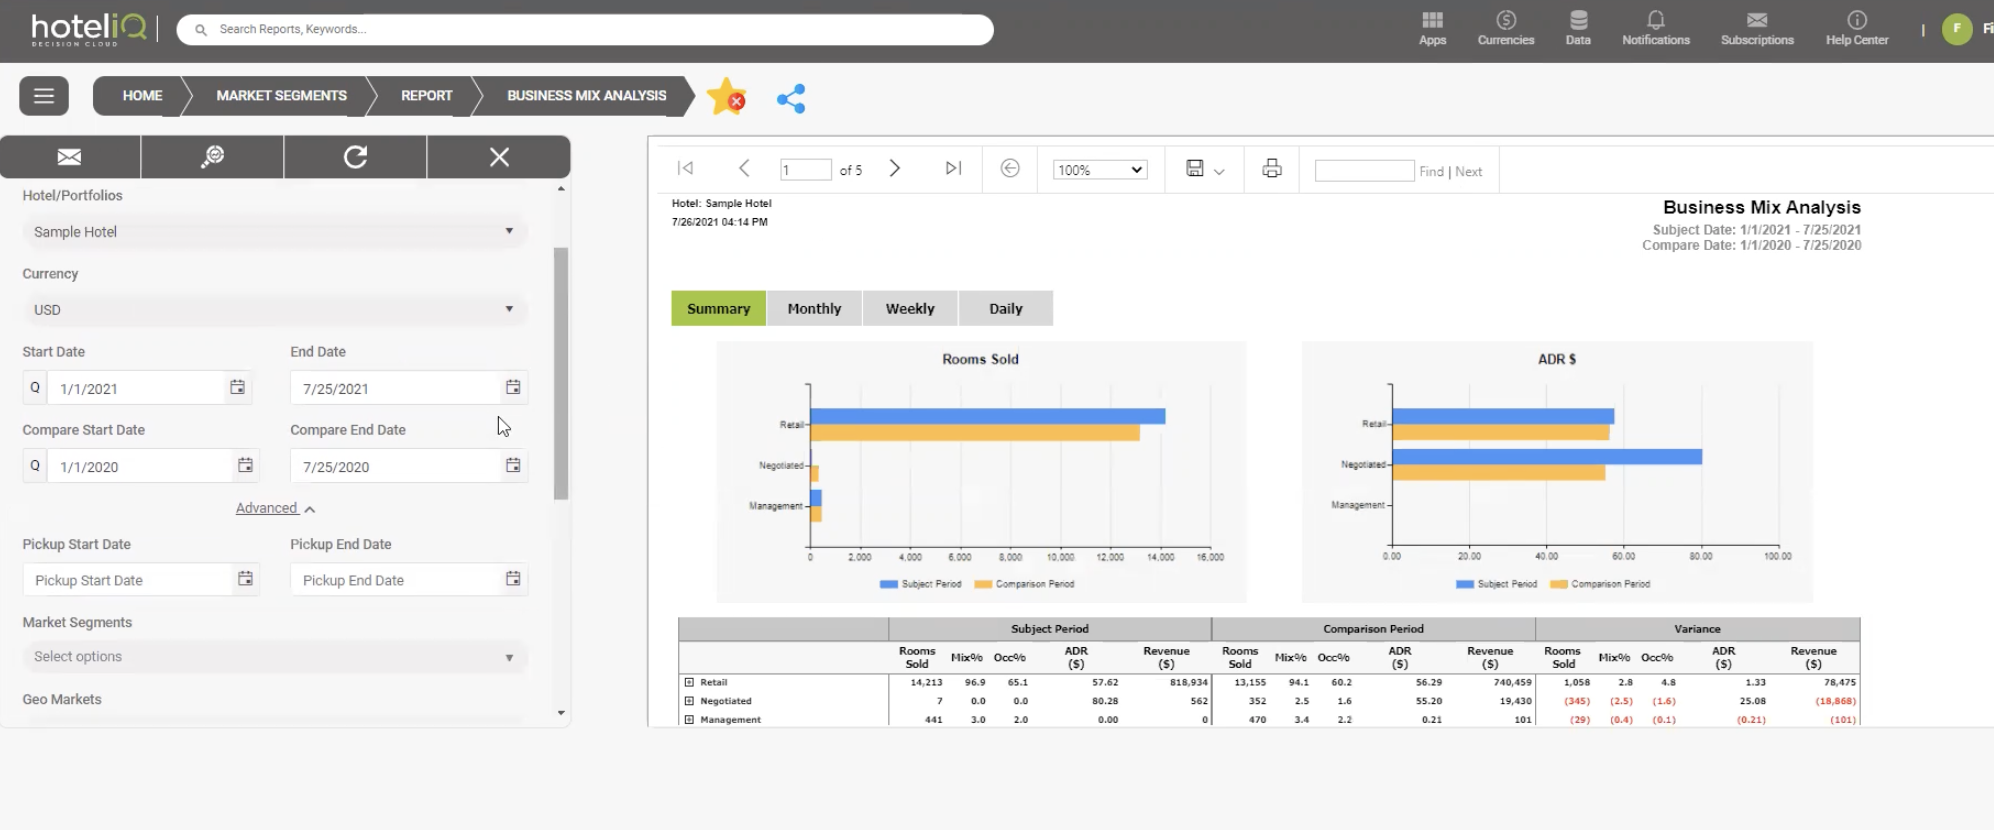
Although HotelIQ is packed with valuable reports, every hotel business is different, so if you don’t see a report you need, you can always create your own using the Sandbox Self-Service app.
Organize: Data Management
While the analytics module of HotelIQ is certainly powerful, it can be useless if you don’t start with accurate data. HotelIQ’s data management features make it easy for you to clean, correct, and standardize data across your portfolio to ensure you can trust your reports.
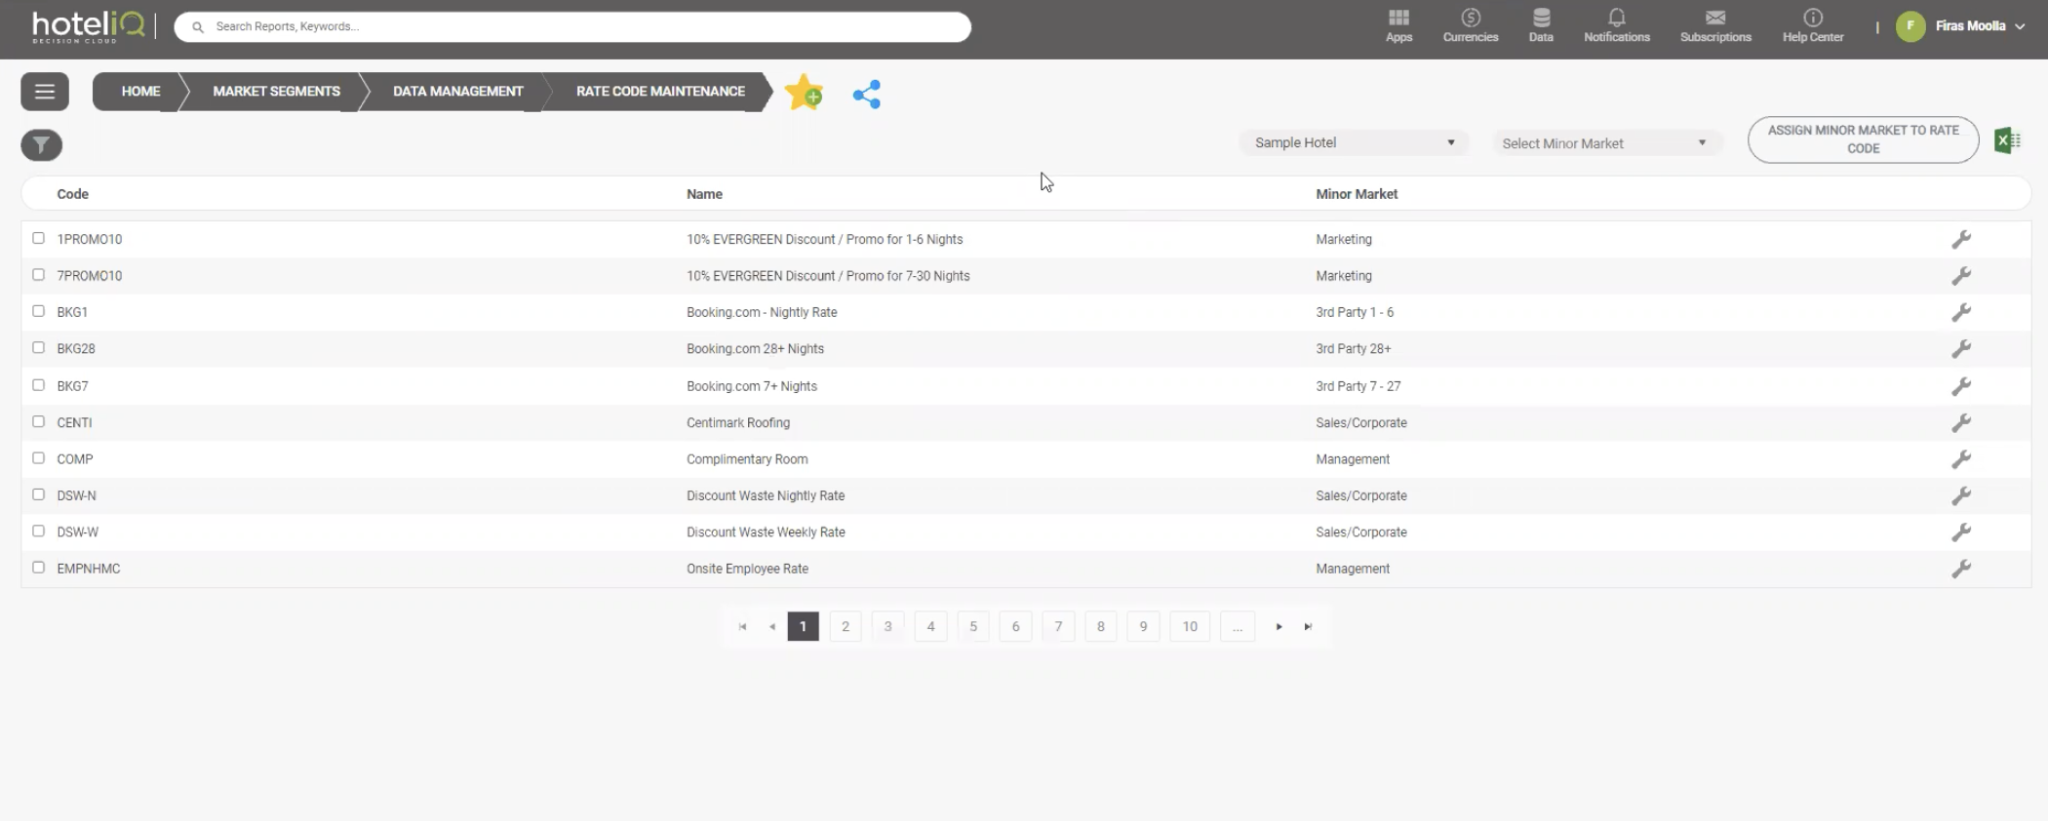
One essential and time-saving feature is Rate Code Maintenance, which enables you to quickly fix miscategorized rate codes. For example, if several hotels in your portfolio books rooms for the same corporate account, Bob’s Bank, but one hotel uses rate code BOBSBANK and another hotel uses BOBBANK, you can edit the rate codes in HotelIQ to match so they flow into the same line item on reports. Note that these changes are only for reporting purposes within HotelIQ, the changes do not flow back to the PMS.
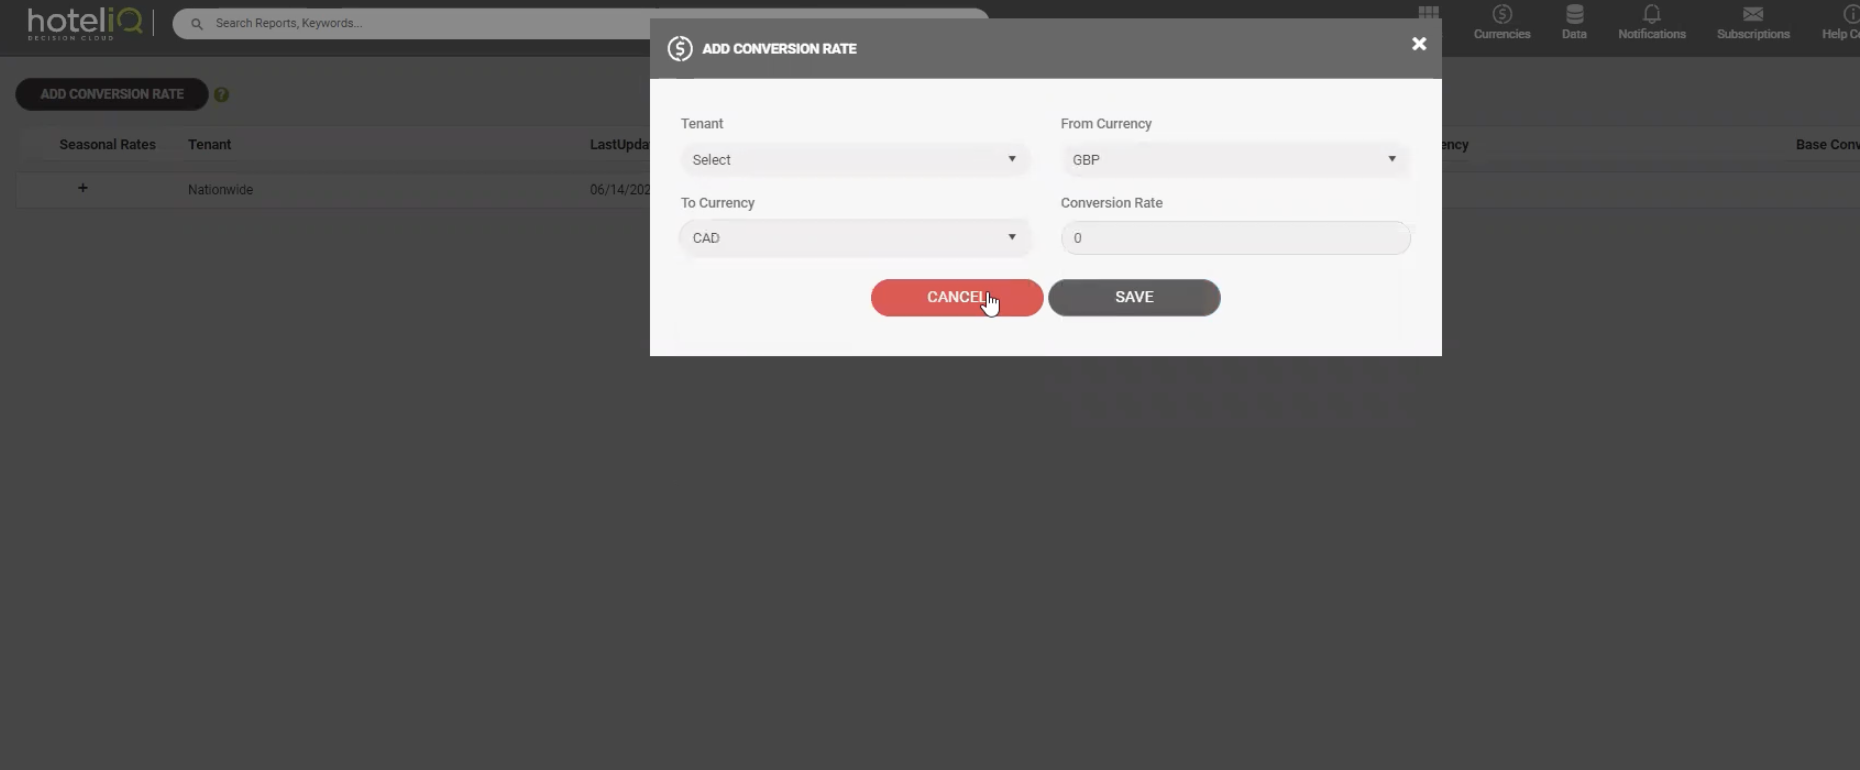
Another handy functionality for multinational hotel chains or management companies is the Currencies module. HotelIQ allows you to build in your own conversion rates for specific date ranges (per month, for instance) and add the currency settings to specific hotels. For example, if you operate hotels in Mexico, Canada, and the US, but your corporate office is in the US, you might want to see high-level reports in US Dollars. These settings allow you to view portfolio-level reporting and forecasts in one currency.
Since HotelIQ receives data from the PMS daily, you want to know immediately if the system picks up a data error or an inconsistency. The Alerts pane on the HotelIQ homepage contains real-time notifications of data errors that need to be addressed.
Plan: Forecast Trends and Operationalize Data
With so many reports available, it’s important to remember that the goal of HotelIQ isn’t just to analyze data, but to use that data to make decisions. HotelIQ will soon launch an updated Forecast module which will help hoteliers plan for the future aided by Machine Learning (ML), but in the meantime, the app has a few ways to help you put the data to use in the real world.
The HotelIQ Concierge contains a collection of tours and guides to show you how to use each feature in the app. There’s also a walk-through tour which will take you step-by-step through the various modules to help you feel confident operationalizing the learnings you find in the reports.
Answers to frequently asked questions can be found in the Help Center, and if you’d like further assistance or some hands-on training, you can always reach out to the HotelIQ Service Desk.
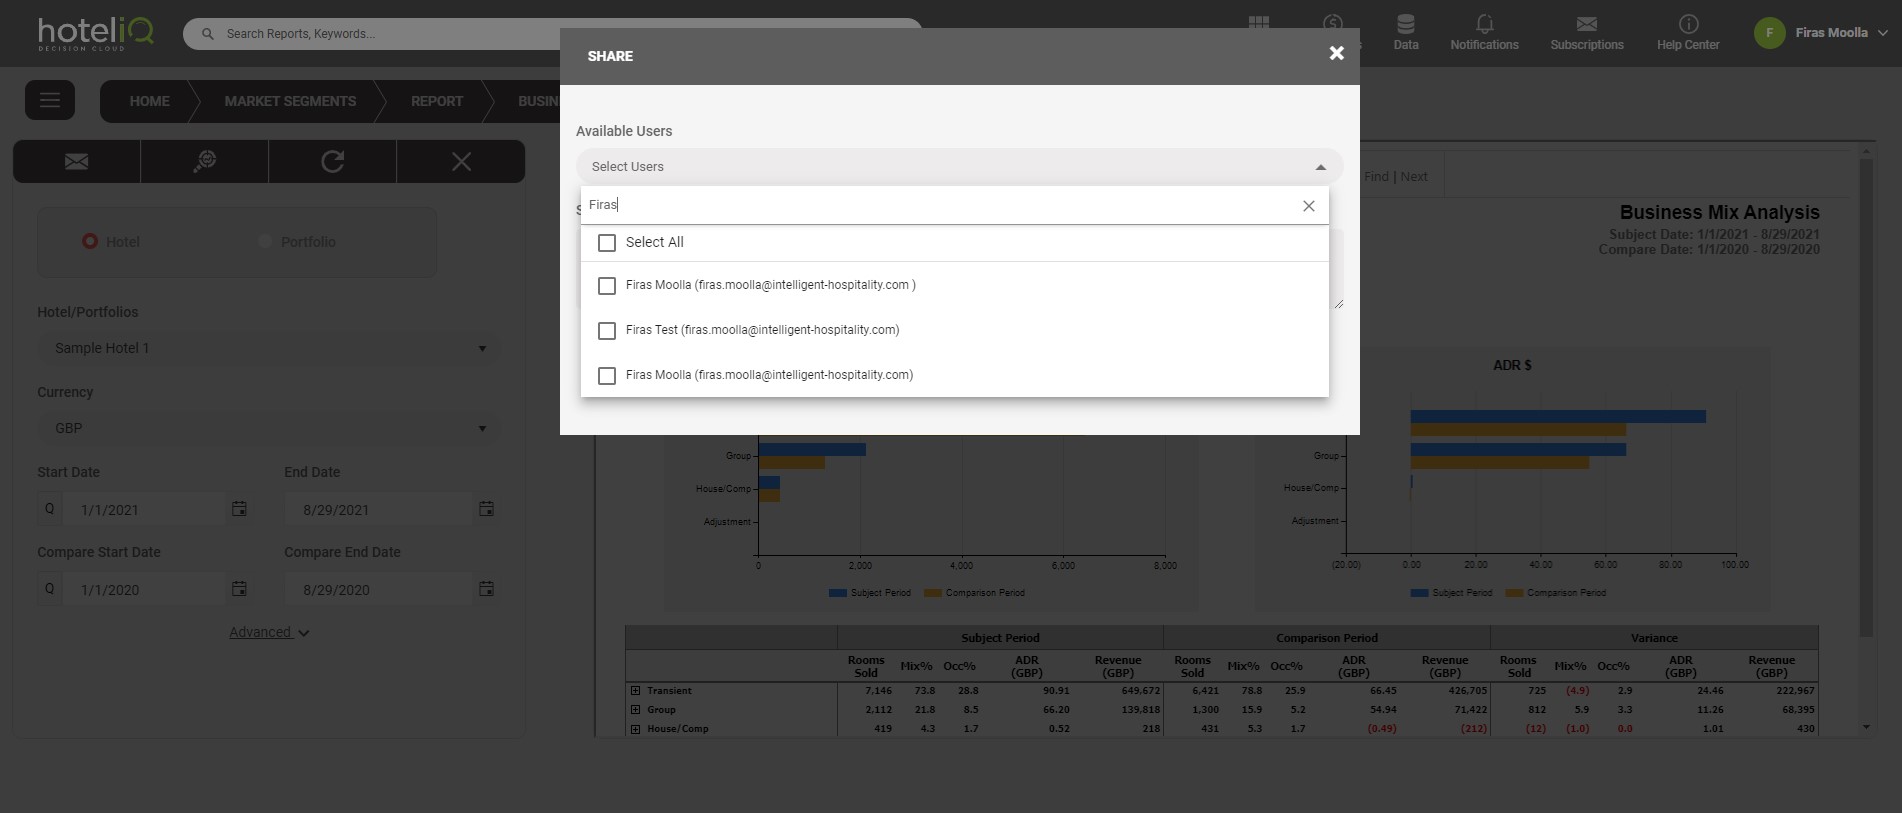
Collaborate: Sharing and Subscriptions
Finally, HotelIQ gives hoteliers tools for better collaboration across teams, hotels, and companies. Data is most powerful and operational when it’s democratized, so the software encourages users to share reports or set up subscriptions to ensure anyone who needs data can get it easily.
On every report, you’ll see a “share” icon which lets you send that exact report to any user, including your selected parameters and filters. But manually sending reports isn’t always efficient, so there’s also an option to schedule report sends on a custom cadence. For example, you could schedule a pace report to go out to the entire sales team every Monday at 8am. This ensures everybody is looking at the same data, without the manual work of exporting the report, attaching it to an email, and hitting “send” manually.
Scheduling reports is a great way to get busy or less data-oriented team members comfortable with numbers. By configuring a report that shows exactly the data needed - with filters already applied - you can give general managers or owners a quick snapshot into performance in a format that’s easy to digest.
HotelIQ is Designed for Hotels Groups of All Sizes
HotelIQ puts a lot of analytical muscle and number-crunching functionality into a package that’s approachable and easy to use. HotelIQ shines at large management companies that operate dozens - or hundreds - of hotels in many markets, and its software is built to accommodate multiple currencies, portfolio groupings, and user types. It’s also ideal for hotels that have heavy corporate business, with reporting that lets you drill down to the account level to really understand trends in each micro-segment.
HotelIQ comes at a minimum charge of 100 rooms per month. While for high-end full-service properties that won't be an issue, HotelIQ may be too robust for hostels, b&bs, and smaller independent hotels for whom PMS reports should suffice. Smaller, independent hotels might be intrigued by HotelIQ’s reporting functionality, but these properties likely will not take advantage of all of HotelIQ’s features. Typically hotel groups, management companies, and asset managers with 10 or more properties will benefit most from a solution like HotelIQ.
While perfect for large enterprises, the new Decision Cloud update was designed to provide limited functionality at a lower cost basis to smaller hotel groups who may not have a need for all of the large enterprise capabilities.
This article was originally posted on HotelTechReport.com